library(shiny)
# Define UI for application that draws a histogram
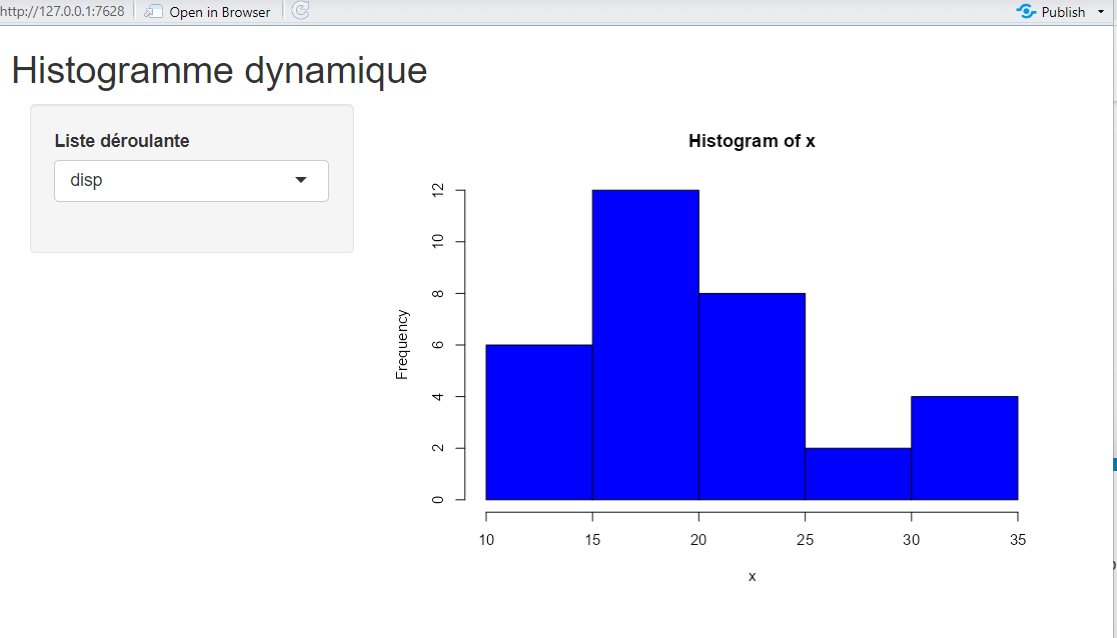
ui <- fluidPage(
# Application title
titlePanel("Histogramme dynamique"),
sidebarPanel(
selectInput('x', 'Liste déroulante', vars),
),
# Show a plot of the generated distribution
mainPanel(
plotOutput("distPlot")
)
)
# Define server logic required to draw a histogram
server <- function(input, output, session) {
output$distPlot <- renderPlot({input$x
# draw the histogram with the specified number of bins
hist(x, col='blue', axes = TRUE, plot = TRUE)
})
}
shinyApp(ui, server)
I assume you refer to the lovely mtcars dataset.
You need to filter your dataset, so only use the column from the input, done here with
x[[input$Selected_Cat]] - please note I changed the inputID to avoid confusion.
library(shiny)

# Define UI for application that draws a histogram
ui <- fluidPage(

  # Application title
  titlePanel("Histogramme dynamique"),


  sidebarPanel(
    selectInput("Selected_Cat", 'Liste déroulante', vars),
    ),

  # Show a plot of the generated distribution
  mainPanel(
    plotOutput("distPlot")
  )
)

# Define server logic required to draw a histogram
server <- function(input, output, session) {
  # define the inputs globally
  x = mtcars
  vars = colnames(mtcars)

  # make plot
  output$distPlot <- renderPlot({

  # draw the histogram with the specified category
    hist(x[[input$Selected_Cat]], col='blue', axes = TRUE, plot = TRUE)
  })
}
shinyApp(ui, server)