Hi all,
I am presenting first the code that is working for me, and the question is under the section MAKE THE GRAPH, for each Subject ID described later on.
I think this may be possible using loops, but I cannot figure out how they work, at least using the two datasets and the different functions.
I have gone as far as making a list with the SUBJECTS from the first dataset (dat_th), but I cannot figure out how to use the list in the functions... I will keep trying and updating this post as I get any further...
Apologies, I haven't find how to make a reprex() with this code, but I have added all the detail to make it reproducible on your end (I Think).
Many thanks for any advise.
Beatriz
Data sets and Packages:
I want to use two different datasets:
- dat: it has the variables I am interested in ( Subject, time and conc)
- dat_th: it has the same variable Subject as the one above , with additional values used in the FUNCTIONS I describe later on.
require(datasets)
library(dplyr)
library(tidyr)
library(purrr)

# Data set:

dat <- Theoph %>%
  rename(time  = Time  )

# Make a additional dataframe with each **Subject**, **th** , "from.1" and "to.1", "from.2" and "to.2"

dat_th <- as.data.frame(unique(Theoph$Subject))
dat_th <- dat_th %>%
  mutate(th = 5)%>%
  rename(Subject  = "unique(Theoph$Subject)")

df <-  data.frame(from.1 = c(0.57, 1.00, 0.27, 0.60,  0.30 , 0.58,
                             0.50, 0.52,  0.01, 0.37, 0.25, 0.5),

                  to.1   = c(1.12, 1.92, 0.58  ,1.07  , 0.52 , 1.15,
                             1.02 , 0.98, 0.3, 0.77, 0.5, 1.0 ),

                  from.2 = c(12.12, 7.03, 7.07, 9.02, 9.10, 3.57,
                             6.98, 5.05, 5.02, 12.10, 5.02, 9.03),

                  to.2   = c(24.37, 9, 9, 11.98, 12, 5,
                             9, 7.15, 7.17, 23.70, 7.03, 12.05))

dat_th <- dat_th %>%
  bind_cols (df )
Functions:
# Functions to use


#a)

conc_time_plots_log <- function(pig_ID) {
  pig_sorted <- dat |>
    filter (Subject == pig_ID)
  pig_sorted
  plot(pig_sorted$time , log(pig_sorted$conc), type = "b" , ylim=c(log(min(dat$conc+1)), log(max(dat$conc)))) # THIS CODE SETS THE LIMITS OF THE PLOT, using the values from "dat" data.frame.
  title(main = pig_ID)
  abline(h=log(dat_th%>%
                 filter(Subject == pig_ID)%>% ### Now it takes the value of "th" from the "dat_th" data.frame, which in this case is column N=2.
                 select(2)), col="blue")
}

#b)

dat_lm_up_linear <- function(pig_ID){
  dat_lm_up <-dat|>
    filter (Subject == pig_ID)%>%
    filter(time %in% c(dat_th%>%
                         filter(Subject == pig_ID)%>% ### Now it takes the value of "from.1" and "to.1" from the "dat_th" data.frame, which in this case is column N=3:4.
                         select(3:4)))
  dat_lm_up
  lm_up<- lm(dat_lm_up$conc ~ dat_lm_up$time)
  lm_up
  return(lm_up)
}

#c)

dat_lm_dw_log <- function(pig_ID){
  dat_lm_dw <-dat|>
    filter (Subject == pig_ID)%>%
    filter(time %in% c(dat_th%>%
                         filter(Subject == pig_ID)%>% ### Now it takes the value of "from.2" and "to.2" from the "dat_th" data.frame, which in this case is column N=5:6.
                         select(5:6)))
  dat_lm_dw
  lm_dw<- lm(log(dat_lm_dw$conc)~ dat_lm_dw$time)
  lm_dw
  return(lm_dw)
}

#d)

IC90_from <- function(pig_ID) {

  lm<-dat_lm_up_linear (pig_ID)


  th<-dat_th%>%
    filter(Subject == pig_ID)%>% ### Now it takes the value of "th" from the "dat_th" data.frame, which in this case is column N=2.
    select(2)

  a <- (th - lm$coefficients[1])/lm$coefficients[2]
  names(a) <- ("IC90_from")

  return(c(lm$coefficients[1],
           lm$coefficients[2],
           th,
           a))
}

#e)

IC90_to  <- function(pig_ID) {

  lm<-dat_lm_dw_log (pig_ID)


  th<-dat_th%>%
    filter(Subject == pig_ID)%>% ### Now it takes the value of "th" from the "dat_th" data.frame, which in this case is column N=2.
    select(2)

  a <- (log(th) - lm$coefficients[1])/lm$coefficients[2]
  names(a) <- ("IC90_to")

  return(c(lm$coefficients[1],
           lm$coefficients[2],
           th,
           a))
}

#f)

Time_over_th <-  function(pig_ID) {
  result <- (round(
    ((IC90_to(pig_ID)$IC90_to)- ( IC90_from(pig_ID)$IC90_from)), 2))
  return(result)
}
MAKE THE GRAPH, for each Subject ID :
The code above works when I use it in the underneath code for each Subject ID, but I would like:
-
That I don't have to modify manually each of the Subject ID numbers manually, but instead to have a code that runs the ID numbers taken from the dataset dat_th and apply them to the functions.
-
That I can make a new data.frame withthe result from the function Time_over_th(Subject) from each of the Subject IDs.
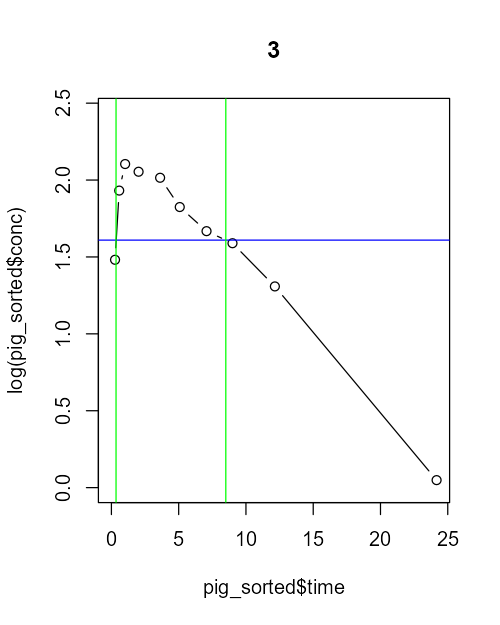
a) Subject = 1
conc_time_plots_log (1)

IC90_from(1)
lw_lim <- IC90_from(1)$IC90_from
abline(v = lw_lim, col = "green")

IC90_to(1)
up_lim <- IC90_to(1)$IC90_to
abline(v = up_lim, col = "green")

Time_over_th(1)
b) Subject = 12
conc_time_plots_log (12)

IC90_from(12)
lw_lim <- IC90_from(12)$IC90_from
abline(v = lw_lim, col = "green")

IC90_to(12)
up_lim <- IC90_to(12)$IC90_to
abline(v = up_lim, col = "green")

Time_over_th(12)
Update with some new code takes me a bit further.
-
I can make a series of plots with the conc and time columns for each Subject but I haven't find yet how to update those plots with the vertical lines obtained from running the functions stated in the code above.
-
The last line of the code lapply(my_list, Time_over_th) works for this data but not when i use other data.
For other data with same structure I get the following message:
Error in lm.fit(x, y, offset = offset, singular.ok = singular.ok, ...) :
0 (non-NA) cases
I think the message is due to the fact that in my data set I have Subject for which the Time_over_th is zero and the lm() cannot be calculated as the data for the funcion is NA.
my_list <- list()
for (i in 1:nrow(dat_th)) {
    my_list[[i]] <- list(dat_th$Subject[i])
}
print(my_list)

lapply(my_list, conc_time_plots_log) #WORKS

lapply(my_list, Time_over_th)