There are many ways to move the legend and you can read about them by entering
?legend
in the console. Here are a few examples.
counts=table(mtcars$carb,mtcars$cyl)
counts
#>
#> 4 6 8
#> 1 5 2 0
#> 2 6 0 4
#> 3 0 0 3
#> 4 0 4 6
#> 6 0 1 0
#> 8 0 0 1
condtab =100*prop.table(counts,2)
condtab
#>
#> 4 6 8
#> 1 45.454545 28.571429 0.000000
#> 2 54.545455 0.000000 28.571429
#> 3 0.000000 0.000000 21.428571
#> 4 0.000000 57.142857 42.857143
#> 6 0.000000 14.285714 0.000000
#> 8 0.000000 0.000000 7.142857
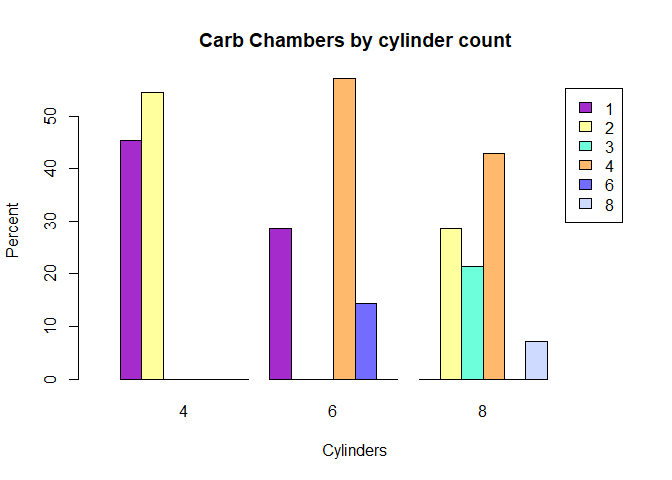
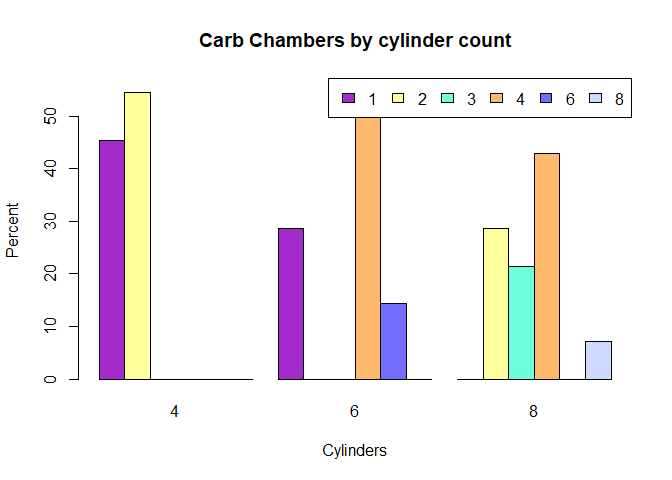
barplot(condtab, main="Carb Chambers by cylinder count",xlab="Cylinders",
ylab="Percent",
col=c("#a62bcd","#ffff9d","#6dffdc","#ffb96d","#736dff","#cedaff"),
legend.text =rownames(counts),beside=TRUE)
barplot(condtab, main="Carb Chambers by cylinder count",xlab="Cylinders",
        ylab="Percent",
        col=c("#a62bcd","#ffff9d","#6dffdc","#ffb96d","#736dff","#cedaff"),
        legend.text =rownames(counts),beside=TRUE,
        args.legend = list(x = "topright", horiz = TRUE))
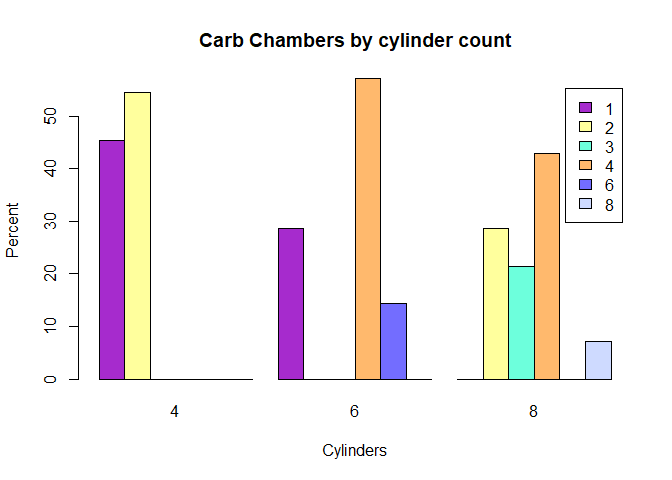
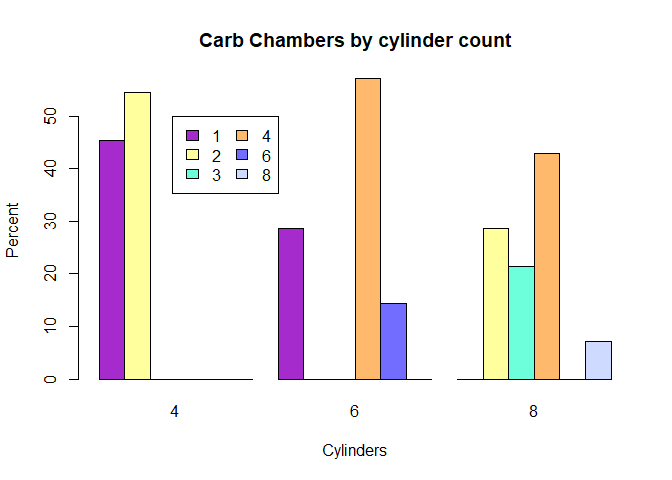
barplot(condtab, main="Carb Chambers by cylinder count",xlab="Cylinders",
        ylab="Percent",
        col=c("#a62bcd","#ffff9d","#6dffdc","#ffb96d","#736dff","#cedaff"),
        legend.text =rownames(counts),beside=TRUE,
        args.legend = list(x = 8, y = 50, ncol = 2))
Created on 2020-04-15 by the reprex package (v0.3.0)