Good evening ! I have a problem with my Chorolayer code for mapping. Can you help me ? I have to make a map on the number of Covid patients by department (in France). "Malades" means "sick", is that my var? Also, after st_geometry I have to put my right_join file which links the quantitative and geographical data?
What should I put in “x=…. »?
Thank’s !
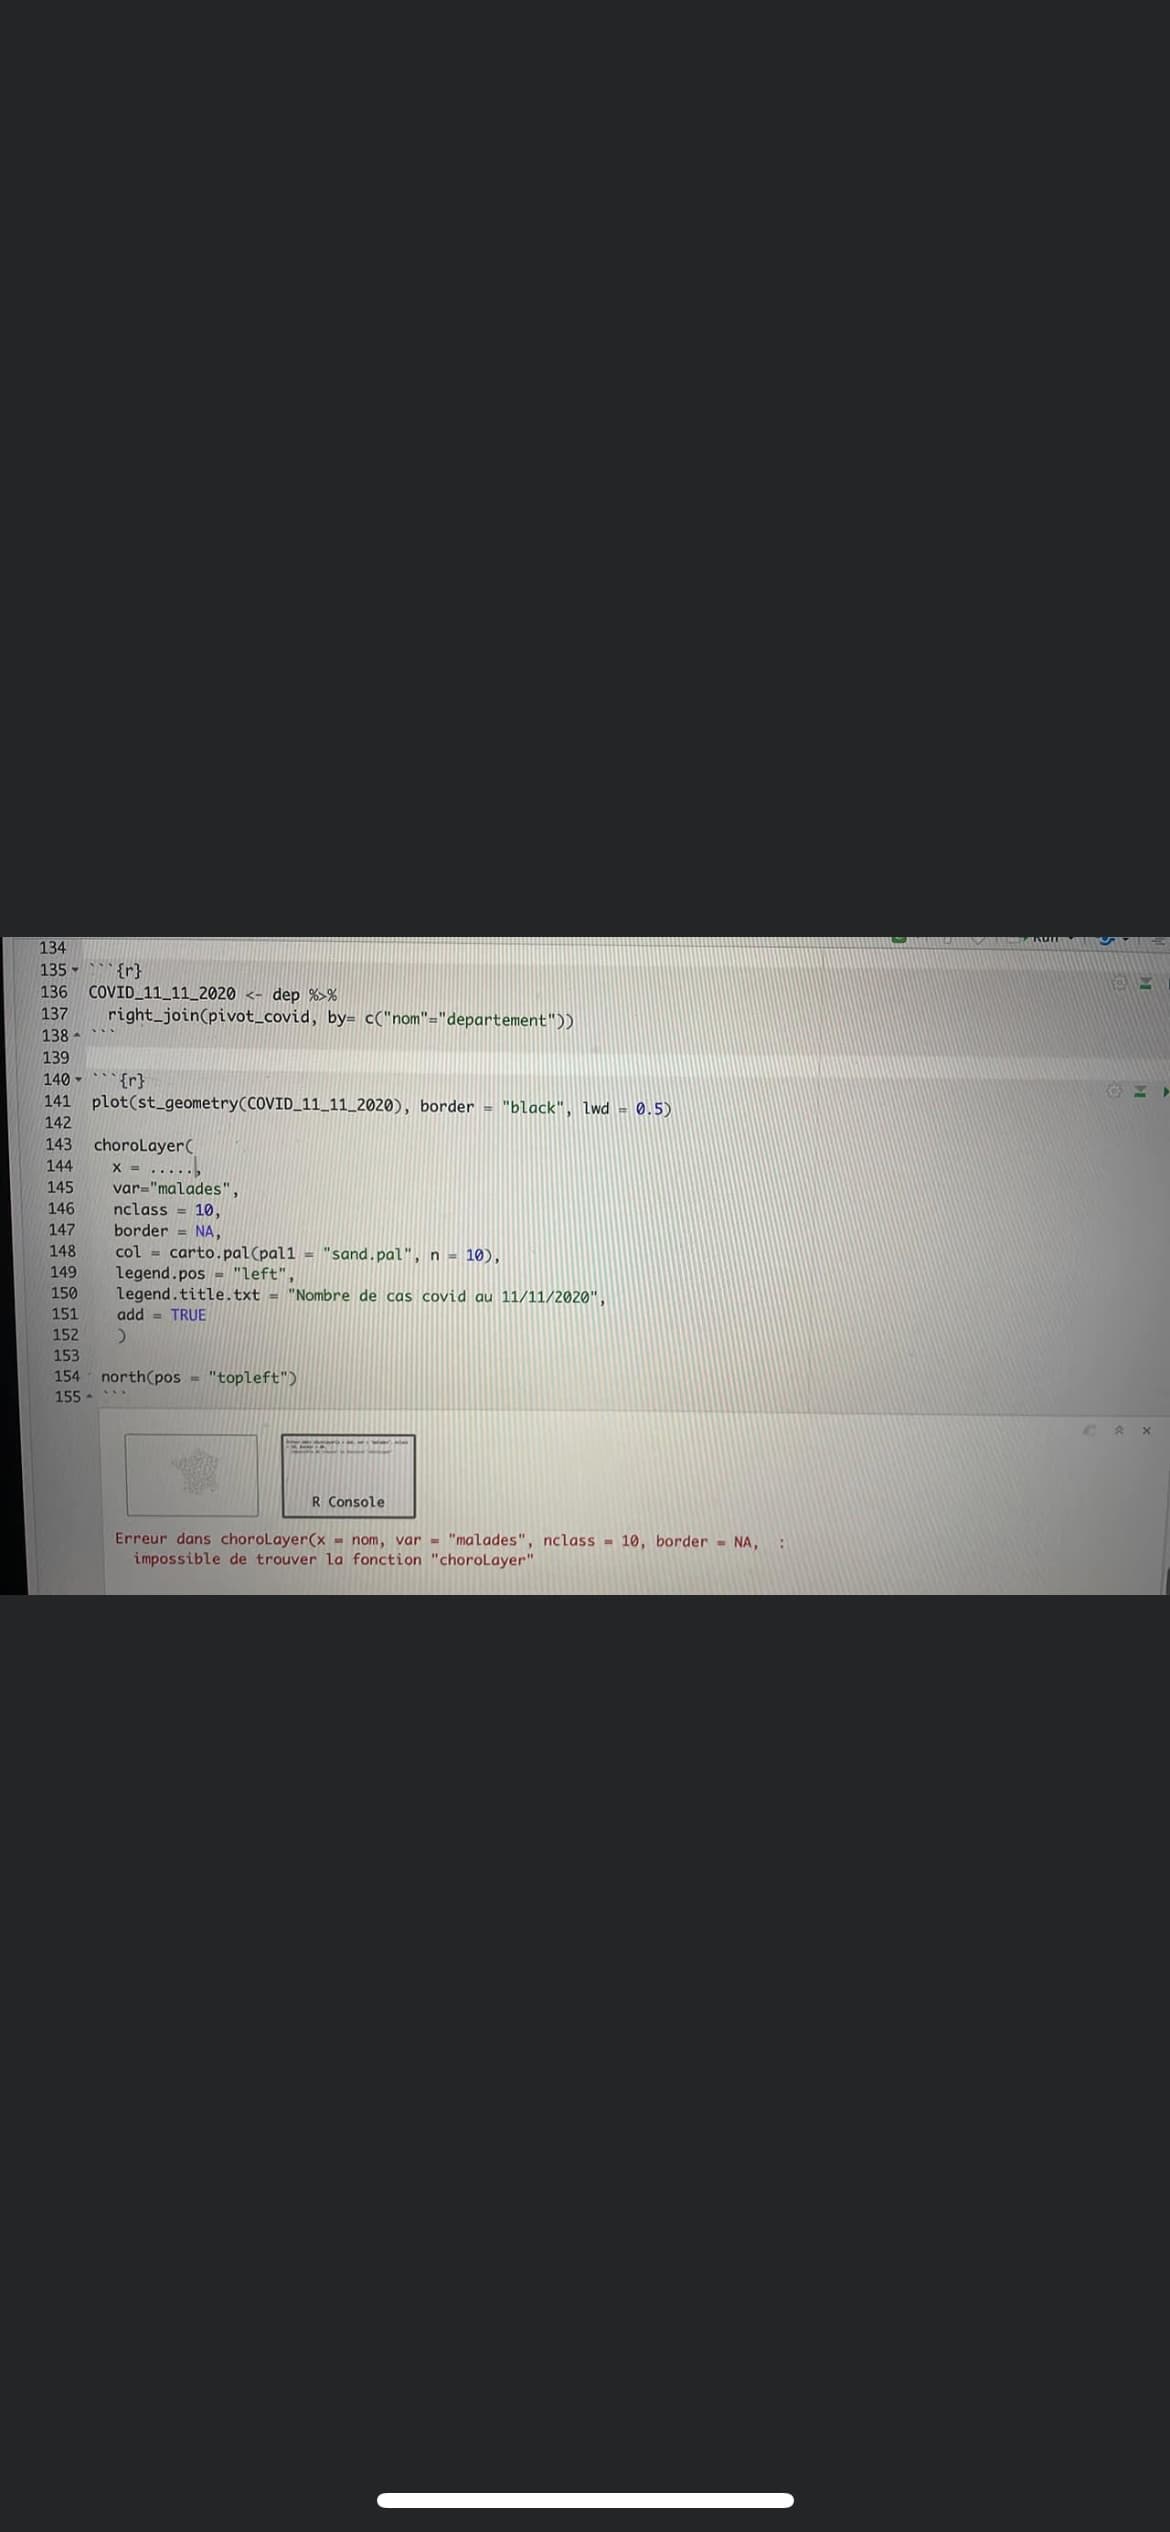
´´´{r}
plot(st_geometry(COVID_11_11_2020), border = « black », lwd = 0.5)
choroLayer( x = …. , var = ’’malades’’, nclass = 10, border = NA, col = cartopal(pal1 = ’’sand.pal’’, n = 10 ), legend.pos = ’’left’’, legend.title.txt = ’’Nombre de cas Covid en France au 11/11/2020’’, add = TRUE )