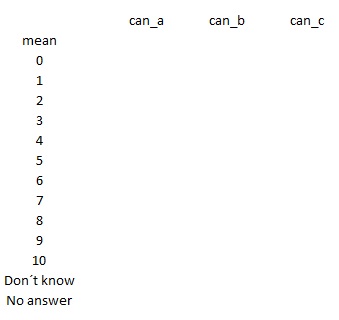
Help. Freq table.

Hi everybody

I have this data:

# fake data
set.seed(1)
z <- data.frame(matrix(ncol = 3, nrow = 2000))

names(z) <- c('can_a', 'can_b', 'can_c')
z$can_a <- sample(x = c(0:10, 88, 99), size = nrow(z), replace = TRUE)
z$can_b <- sample(x = c(0:10, 88, 99), size = nrow(z), replace = TRUE)
z$can_c <- sample(x = c(0:10, 88, 99), size = nrow(z), replace = TRUE)

z$can_a <- factor(z$can_a, levels = c(1:10, 88, 99),
                   c('0', '1', '2', '3', '4', '5', '6', '7', '8', '9',
                     'DonĀ“t know', 'No answer'))
z$can_b <- factor(z$can_b, levels = c(1:10, 88, 99),
                   c('0', '1', '2', '3', '4', '5', '6', '7', '8', '9',
                     'DonĀ“t know', 'No answer'))
z$can_c <- factor(z$can_c, levels = c(1:10, 88, 99),
                   c('0', '1', '2', '3', '4', '5', '6', '7', '8', '9',
                     'DonĀ“t know', 'No answer'))

IĀ“m trying to summarize the data like in the image, and I want to save it as a data frame (as proportion, instead of counts):
summ_table

The mean should be calculated only for levels [0:10].

Any suggestion on a proper viz for this table would be appreciated too.
Thank you very much.

Hey Carlos

is what you are looking for is to create a pivot table from the existing data.frame ?

if yes . please install the package : pivottabler

and look at the below guideline :
https://cran.r-project.org/web/packages/pivottabler/vignettes/v00-vignettes.html

if its still not clear please let me know .

Kind Regards

1 Like

Thank you very much. I didnĀ“t know about pivottabler.

In this case, I need this result (given the previous df), but in a cleaner and practical way:

aa <- round(prop.table((table(can_a)))*100, 2)
bb <- round(prop.table((table(can_b)))*100, 2)
cc <- round(prop.table((table(can_c)))*100, 2)

z1 <- data.frame(aa, bb, cc)
z1 <- z1 %>% 
  select(can_a, Freq, Freq.1, Freq.2)
names(z1) <- c('punct', 'can_a', 'can_b', 'can_c')
z1

Again. thank you

PD: i need the mean for each variable (can_a, can_b, can_c) as a row in z1

It is kind of tedious to do it this way, but I have no nicer solution in mind right now:

# fake data
set.seed(1)
z <- data.frame(matrix(ncol = 3, nrow = 2000))

names(z) <- c('can_a', 'can_b', 'can_c')
z$can_a <- sample(x = c(0:10, 88, 99), size = nrow(z), replace = TRUE)
z$can_b <- sample(x = c(0:10, 88, 99), size = nrow(z), replace = TRUE)
z$can_c <- sample(x = c(0:10, 88, 99), size = nrow(z), replace = TRUE)

# corrected the labels, since before they coerced to NAs
z$can_a <- factor(z$can_a, levels = c(0:10, 88, 99),
                  c('0', '1', '2', '3', '4', '5', '6', '7', '8', '9', '10',
                    'DonĀ“t know', 'No answer'))
z$can_b <- factor(z$can_b, levels = c(0:10, 88, 99),
                  c('0', '1', '2', '3', '4', '5', '6', '7', '8', '9', '10',
                    'DonĀ“t know', 'No answer'))
z$can_c <- factor(z$can_c, levels = c(0:10, 88, 99),
                  c('0', '1', '2', '3', '4', '5', '6', '7', '8', '9', '10',
                    'DonĀ“t know', 'No answer'))

####
library(dplyr); library(tidyr)

# calculate frequencies
frequencies <- z |>
  pivot_longer(cols = everything(), names_to = 'can', values_to = 'value') |>
  group_by(can,value) |>
  summarise(
    frequency = n()/nrow(z)
  ) |> ungroup() |>
  pivot_wider(values_from = 'frequency', names_from = 'can')
#> `summarise()` has grouped output by 'can'. You can override using the `.groups`
#> argument.

# get the mean additionally
the_means <- z |>
  pivot_longer(cols = everything(), names_to = 'can', values_to = 'value') |>
  filter(value %in% 0:10) |>
  group_by(can) |>
  summarise(
    mean = mean(as.numeric(value))
  ) |> ungroup() |>
  pivot_wider(values_from = 'mean', names_from = 'can') |>
  # add a column "value" for binding later
  mutate(value = 'mean')

# put together
result <- bind_rows(the_means,frequencies) |> select(value,everything())
result
#> # A tibble: 14 Ɨ 4
#>    value       can_a  can_b  can_c
#>    <chr>       <dbl>  <dbl>  <dbl>
#>  1 mean       6.11   6.08   5.99  
#>  2 0          0.066  0.071  0.076 
#>  3 1          0.0705 0.0755 0.076 
#>  4 2          0.0765 0.0685 0.0825
#>  5 3          0.0785 0.0765 0.0755
#>  6 4          0.082  0.075  0.072 
#>  7 5          0.0785 0.0765 0.077 
#>  8 6          0.081  0.083  0.073 
#>  9 7          0.075  0.079  0.071 
#> 10 8          0.0885 0.073  0.081 
#> 11 9          0.0835 0.0855 0.0735
#> 12 10         0.0685 0.071  0.079 
#> 13 DonĀ“t know 0.076  0.078  0.079 
#> 14 No answer  0.0755 0.0875 0.0845

Created on 2022-09-03 by the reprex package (v2.0.1)

I have corrected the creation of your factor variables above, since you coerced NAs beforehand. I hope it fulfills your needs. :slight_smile:

Kind regards

2 Likes

Thank you very much @FactOREO

Just what I was looking for.
I added some lines after IĀ“ve found gt package, hopping they can be useful, and as a way to say "thank you".

library(gt)
library(tidyverse)

names(frequencies) <- c('Values', 'candidate 1', 'candidate2', 'candidate 3')
frequencies %>% 
  gt() %>% 
  tab_header(
    title = 'Punctuations'
  ) %>% 
  fmt_percent(columns = 2:4) %>%
  opt_stylize(style = 6, color = 'gray', add_row_striping = FALSE) %>% 
  data_color(
    columns = c(2:4),
    colors = scales::col_numeric(
      palette = c("#e94b44", "#d3d6d6", "#005d70"),
      domain = c(0.06,0.09)
    )
  )

the_means2 <- the_means %>% 
  select(1:3)

names(the_means2) <- c('candidate 1', 'candidate2', 'candidate 3')  
the_means2 %>% 
  gt() %>% 
  tab_header(
    title = 'Average punctuation'
  ) %>% 
  fmt_number(columns = 1:3) %>% 
  opt_stylize(style = 6, color = 'gray', add_row_striping = TRUE) %>% 
  tab_footnote(
    footnote = 'only for punctuations between 0 and 10',
    locations = cells_title(),
  )

This topic was automatically closed 7 days after the last reply. New replies are no longer allowed.

If you have a query related to it or one of the replies, start a new topic and refer back with a link.