Help creating a simple leaflet interactive plot in R Shiny

Hello everyone!

I'm currently in the process of making a Shiny app using the leaflet library. However, I'm not quite sure where to start, and I'd like a "skeleton app" to get me started.

Could anyone make a simple Shiny App containing a plot of Ohio's counties (zooming capability not necessary) shaded such that darker=higher population, and with the ability to hover over a county with the mouse and see the population as a number?

Hope it's not too much trouble. Thank you so much!

Hi @EricLi0480 ,

this code will get you started:

# libraries you need
library(shiny)
library(leaflet)
library(sf)

# Population data Ohio downloaded from https://www.ohio-demographics.com/counties_by_population
ohioPopulation <- read.csv2(file = "ohio_population.csv")

# Ohio shape file downloaded from https://public.opendatasoft.com/explore/dataset/us-county-boundaries/export/?disjunctive.statefp&disjunctive.countyfp&disjunctive.name&disjunctive.namelsad&disjunctive.stusab&disjunctive.state_name&location=8,40.58293,-80.45563&basemap=jawg.light
ohioShapes <- st_read("us-county-boundaries/us-county-boundaries.shp")
# Filter only for Ohio
ohioShapes <- ohioShapes[which(ohioShapes$state_name == "Ohio"),]

# Add population to shape file
ohioShapesLeaflet <- merge(x = ohioShapes, y = ohioPopulation, by.x = "namelsad", by.y = "name", all.x = TRUE)

# from https://rstudio.github.io/leaflet/articles/colors.html
pal <- colorNumeric(palette = "Blues",
                    domain = ohioShapesLeaflet$population)

# Define UI for application
ui <- fluidPage(

    # Application title
    titlePanel("Posit 182374"),

    # Application layout
    leafletOutput("ohio")
)

# Define server logic 
server <- function(input, output, session) {
    
    # render the map
    output$ohio <- renderLeaflet({
        leaflet() %>%
            addTiles() %>% 
            addPolygons(data = ohioShapesLeaflet,
                        # from https://rstudio.github.io/leaflet/articles/colors.html
                        stroke = FALSE,
                        smoothFactor = 0.2, 
                        fillOpacity = 1,
                        color = ~pal(population),
                        label = ~paste0(namelsad, " -> ", population)
            )

    })

}

# Run the application 
shinyApp(ui = ui, server = server)


Output:

Links to the source files are commented in the code.

Under Create Interactive Web Maps with the JavaScript Leaflet Library • leaflet you will find the nice documentation for the package.

Thank you! I'm currently trying to locate that csv file you downloaded, but it seems like the link only contains an excel file. Where did you find the csv version? I tried converting the file, but the csv file came out formatted weirdly.

Hi,
i just copied it and changed all formatting to none.

Here the equivalent R object:

ohioPopulation <- structure(list(name = c("Ohio", "Adams County", "Allen County", 
                        "Ashland County", "Ashtabula County", "Athens County", "Auglaize County", 
                        "Belmont County", "Brown County", "Butler County", "Carroll County", 
                        "Champaign County", "Clark County", "Clermont County", "Clinton County", 
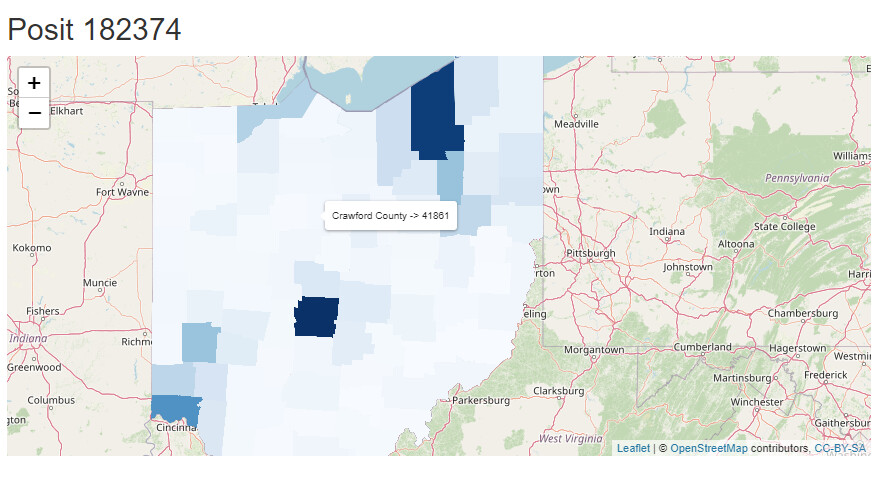
                        "Columbiana County", "Coshocton County", "Crawford County", "Cuyahoga County", 
                        "Darke County", "Defiance County", "Delaware County", "Erie County", 
                        "Fairfield County", "Fayette County", "Franklin County", "Fulton County", 
                        "Gallia County", "Geauga County", "Greene County", "Guernsey County", 
                        "Hamilton County", "Hancock County", "Hardin County", "Harrison County", 
                        "Henry County", "Highland County", "Hocking County", "Holmes County", 
                        "Huron County", "Jackson County", "Jefferson County", "Knox County", 
                        "Lake County", "Lawrence County", "Licking County", "Logan County", 
                        "Lorain County", "Lucas County", "Madison County", "Mahoning County", 
                        "Marion County", "Medina County", "Meigs County", "Mercer County", 
                        "Miami County", "Monroe County", "Montgomery County", "Morgan County", 
                        "Morrow County", "Muskingum County", "Noble County", "Ottawa County", 
                        "Paulding County", "Perry County", "Pickaway County", "Pike County", 
                        "Portage County", "Preble County", "Putnam County", "Richland County", 
                        "Ross County", "Sandusky County", "Scioto County", "Seneca County", 
                        "Shelby County", "Stark County", "Summit County", "Trumbull County", 
                        "Tuscarawas County", "Union County", "Van Wert County", "Vinton County", 
                        "Warren County", "Washington County", "Wayne County", "Williams County", 
                        "Wood County", "Wyandot County"), 
                        population = c(11774683L, 27509L, 
                                       102087L, 52522L, 97666L, 61276L, 46263L, 66554L, 43715L, 388327L, 
                                       26761L, 38715L, 135877L, 208851L, 42077L, 101723L, 36629L, 41861L, 
                                       1256620L, 51751L, 38300L, 216074L, 75299L, 159371L, 28901L, 1318149L, 
                                       42602L, 29276L, 95455L, 167567L, 38409L, 827671L, 75072L, 30622L, 
                                       14528L, 27601L, 43285L, 28104L, 44273L, 58518L, 32563L, 65280L, 
                                       62657L, 232236L, 57994L, 178844L, 46098L, 313101L, 430014L, 43961L, 
                                       227979L, 65366L, 182347L, 22242L, 42321L, 108818L, 13401L, 536121L, 
                                       13851L, 35049L, 86393L, 14216L, 40367L, 18827L, 35451L, 58809L, 
                                       27151L, 161217L, 40929L, 34400L, 125008L, 76957L, 58885L, 73716L, 
                                       55062L, 48145L, 374199L, 539361L, 201749L, 92840L, 63411L, 28833L, 
                                       12790L, 243189L, 59639L, 116680L, 36973L, 131564L, 21818L)), 
                        class = "data.frame", 
                        row.names = c(NA,-89L))
1 Like

Thank you! I apologize, but I have another question--I'm having a bit of difficulty working with my own datasets. I'm using the 2018 and 2020 datasets for Ohio located here as csv files: CDC/ATSDR SVI Data and Documentation Download | Place and Health | ATSDR .

These are in a subfolder data-oh within the folder containing my app, ui, and server. However, I'm getting a lot of very strange errors when running my code. For example, the merge command works perfectly fine for the 2020 dataset, but not the 2018 one. Could you please take a look at my code? Thank you so much for your time!

server.R:

server <- function(input, output, session) {
  
  # Allow user to choose column of dataset
  output$datasetcolumn2 <- renderUI({
    chosen_dataset <- read.csv(paste("data-oh/", input$datasetname, sep = ""))
    selectInput("datasetcolumn", "Data choice:",
                # Only allow user to plot numerical data
                Filter(function(x) class(chosen_dataset[,match(x, names(chosen_dataset))])=="numeric",
                       names(chosen_dataset))
    )
  })


  # Map output for Ohio
  output$map_oh <- renderPlot({
    # Shapefile of all counties in USA
    shapefile <- st_read("us-county-boundaries/us-county-boundaries.shp")
    shapefile_oh <- shapefile[which(shapefile$state_name == "Ohio"),]
    
    chosen_dataset_oh <- read.csv(paste("data-oh/", input$datasetname, sep = ""))
    
    chosen_column <- input$datasetcolumn
    chosen_index <- match(chosen_column, names(chosen_dataset_oh))
    
    print(chosen_dataset_oh$FIPS)
    
    # Merge shapefile with desired data
    leaflet_oh <- merge(x = shapefile_oh, 
                        y = chosen_dataset_oh[,c(6,chosen_index)], 
                        by.x = "geoid", by.y = "FIPS", 
                        all.x = TRUE)
    
    pal <- colorNumeric(palette = "Blues", domain = chosen_dataset_oh[,chosen_index])
    
    names(leaflet_oh)[21] <- "X"
    output$map_oh <- renderLeaflet({
      leaflet() %>%
        addTiles() %>% 
        addPolygons(data = leaflet_oh,
                    stroke = FALSE,
                    smoothFactor = 0.2, 
                    fillOpacity = 1,
                    color = ~pal(X),
                    label = ~paste0(namelsad, "=", X)
        )
    })
  })
}

ui.R:

ui <- fluidPage(
  title = "OH PA Datasets",
  titlePanel("Visualizing Ohio and Pennsylvania Datasets"),
  sidebarPanel(
    selectInput("datasetname", "Select dataset:",
                list.files(paste(getwd(), "/data-oh", sep = "")) # List of datasets
                ),
  ),
  mainPanel(
    uiOutput("datasetcolumn2"), # Dropdown to select data to plot from dataset
    leafletOutput("map_oh")
  )
)

The csvs have different column names and contain different data point overall.
You are also using a fixed column index here

chosen_dataset_oh[,c(6,chosen_index)]

but since the columns differ from file to file different columns will be selected.
Also if the join can't be done (nothing matches) R will not stop - but just give you an column of NAs you should check for that to before you proceed.

This topic was automatically closed 21 days after the last reply. New replies are no longer allowed.

If you have a query related to it or one of the replies, start a new topic and refer back with a link.