Hi Community,
A few days ago I built a dashboard (using flexdashboard) to show some plotly graphs and it worked perfectly fine. But today when I run the dashboard all the graphs are blank.
Triying some plots in the console I figured out that the problem is with plotly as it works well using ggplot2 and R Base graphics, but when I try to plot something simple using plotly:
library(ggplot2)
library(plotly)

plot_ly(x = ~rnorm(50), type = "histogram")
library(ggplot2)
library(plotly)

plot_ly(data = iris, x = ~Sepal.Length, y = ~Petal.Length)
It shows this error:
No trace type specified:
  Based on info supplied, a 'scatter' trace seems appropriate.
  Read more about this trace type -> https://plot.ly/r/reference/#scatter
No scatter mode specifed:
  Setting the mode to markers
  Read more about this attribute -> https://plot.ly/r/reference/#scatter-mode
I don't know what the problem is, does somebody know?
(Also I have RStudio updated to the latest version (R version 3.6.3 (2020-02-29)) and all the packages as well)
It might have to do with which versions of R and plotly are installed. I don't think there was an issue before, so an update might have caused it -- does sessionInfo() show you have the same set up on your computer and on the workplace computer you used?
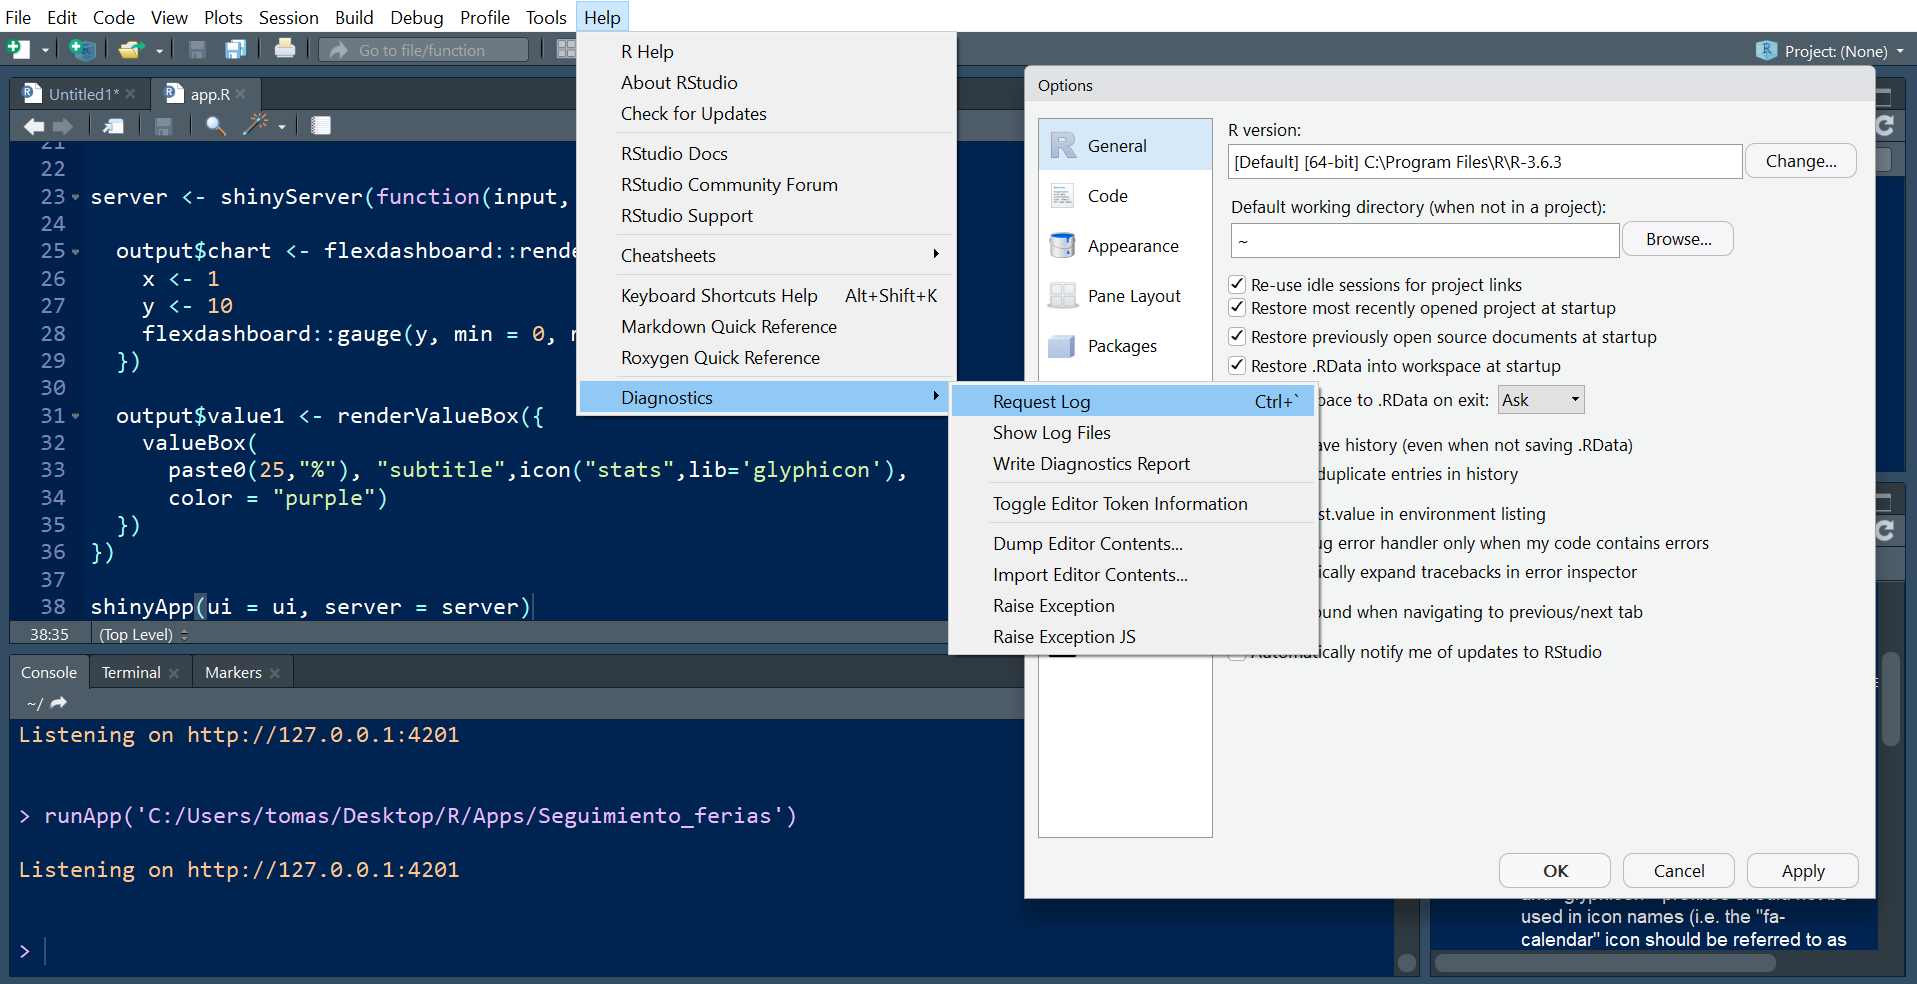
@kevinushey I tried what you told me but I think there's something wrong with my RStudio configuration.
I couldn't find any GPU diagnostics or the advanced tab at the global option.
This is how my RStudio looks:
This doesn't show the version of the packages, so it might be worth checking those, too, although it could be the Windows version difference, too? Did you confirm package info with sessionInfo(), too?
@dromano Well I got the latest version of plotly (4.9.2).
Although, according to sessionInfo(), I have Windows >= 8 x64 (build 9200) I actually have W10 (build 18362.657) as OS.
Could that be the problem?
I'm not sure, but the problem is so prevalent with my students who use Windows that I was suspecting version conflicts. Are you using ggplot2 and ggplotly(), or are using plotly directly? And what are you version numbers for those on both machines?