Is this a violin plot? If so, see Most basic violin plot with ggplot2 – the R Graph Gallery
1 Like
Hi @fcas80
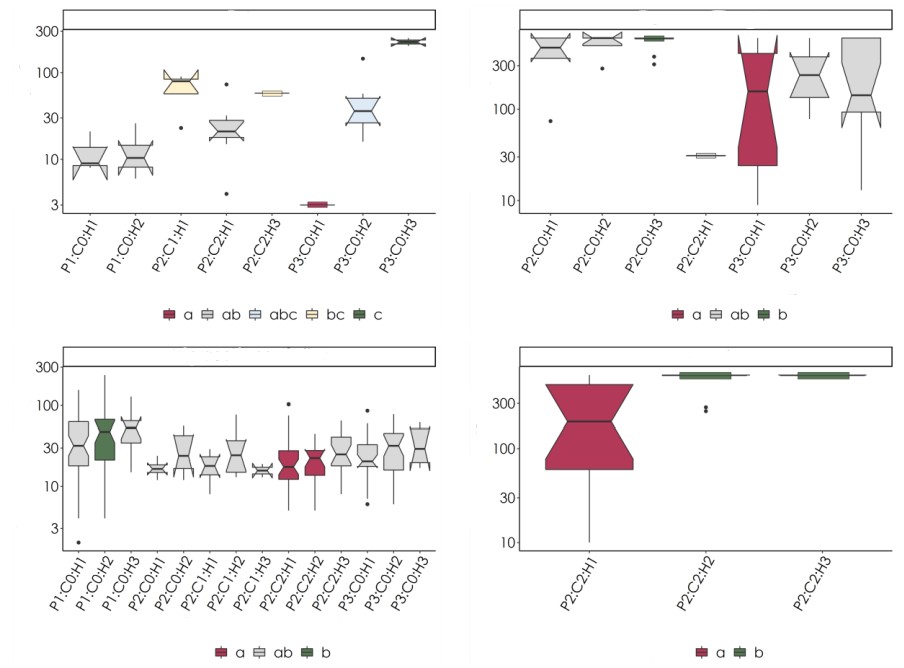
This is most commonly called a notched boxplot. HTH
Hi @Eisawi99, remember put a reproducible example of data for get a better help.
Reprex
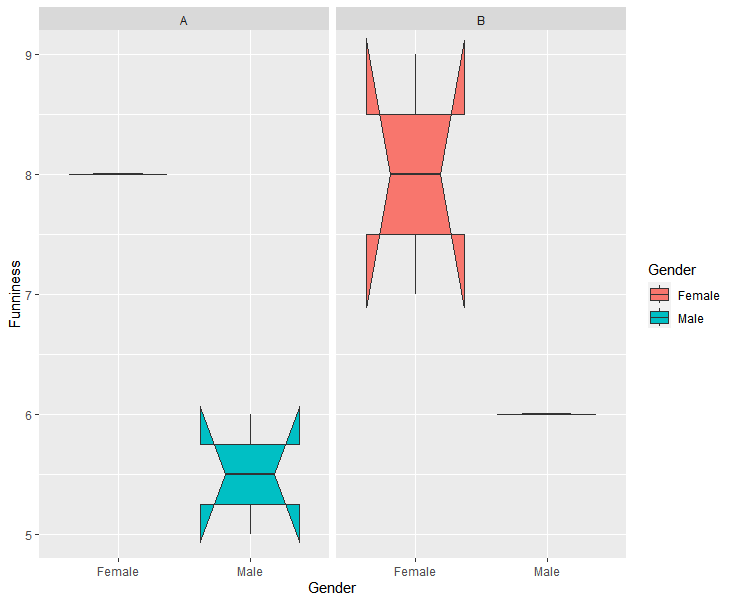
A simple example of this plot is something like that:
library(ggplot2)
HumorData <- data.frame(
  Gender = c("Male", "Female", "Male", "Female", "Male", "Female"),
  Funniness = c(6, 8, 6, 9, 5, 7),
  College = c("A", "A", "B", "B", "A", "B"))

# Create the plot using ggplot2
ggplot(HumorData, aes(x=Gender, y=Funniness, fill=Gender)) +
  geom_boxplot(notch=TRUE) +
  facet_grid(~College)
2 Likes
This topic was automatically closed 21 days after the last reply. New replies are no longer allowed.
If you have a query related to it or one of the replies, start a new topic and refer back with a link.