I'm trying to create a heatmap with dendrograms and I keep getting this error: Error in heatmap: "x" must be a numeric matrix. My data table is comparing the deltact for each specific gene (columns) amongst each subjectID that's on the lefthand side.
It would help if you provided the code you're using. Trying out something:
# Read in the data I copy-pasted from your post
tab <- read.csv("table.csv")
class(tab)
#> [1] "data.frame"
# take a look at first few rows
head(tab)
#> X COX2 S100A7 LMNB1 CCL5 CXCL10 OXTR FLG KLK6 HMOX1 S100A2
#> 1 01-0071 NA 10.6 NA NA NA NA NA NA NA NA
#> 2 01-0081 NA NA 2.40 NA NA NA NA NA 8.57 NA
#> 3 01-0129 NA NA NA NA NA NA NA NA NA 0
#> 4 01-0169 NA NA NA NA NA NA 7.05 NA 4.63 NA
#> 5 01-0277 5.23 10.8 2.41 3.57 NA NA NA NA NA 0
#> 6 01-0281 6.80 NA 3.12 3.38 NA 5.96 7.02 NA NA NA
# Convert to matrix (make sure to keep the first column as rownames)
mat <- as.matrix(tab[,-1])
rownames(mat) <- tab[,1]
# look at top-left corner
mat[1:3,1:3]
#> COX2 S100A7 LMNB1
#> 01-0071 NA 10.6 NA
#> 01-0081 NA NA 2.4
#> 01-0129 NA NA NA
class(mat)
#> [1] "matrix" "array"
typeof(mat)
#> [1] "double"
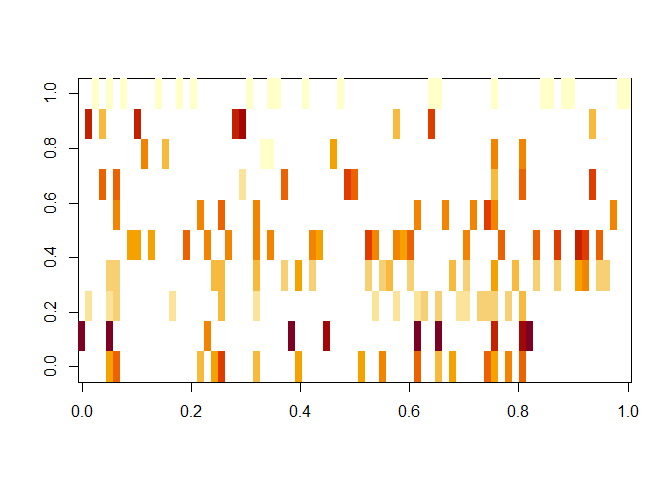
# try plotting it without dendrogram
image(mat)
# this doesn't work because of the many NA
heatmap(mat)
#> Error in hclustfun(distfun(x)): NA/NaN/Inf in foreign function call (arg 10)
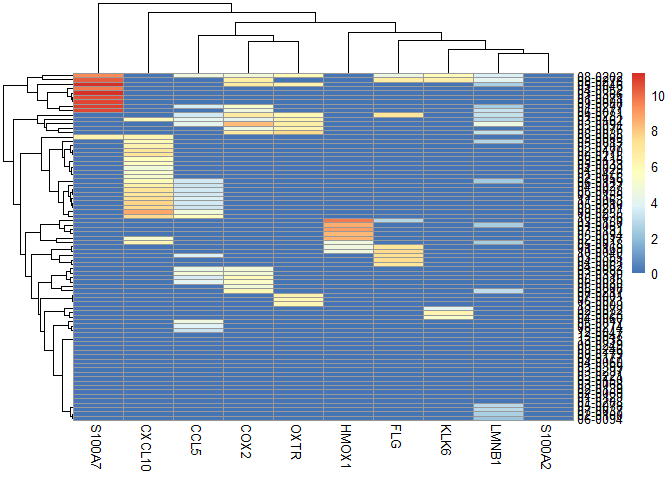
pheatmap::pheatmap(mat)
#> Error in hclust(d, method = method): NA/NaN/Inf in foreign function call (arg 10)
mat[is.na(mat)] <- 0
# take a look
mat[1:3,1:3]
#> COX2 S100A7 LMNB1
#> 01-0071 0 10.6 0.0
#> 01-0081 0 0.0 2.4
#> 01-0129 0 0.0 0.0
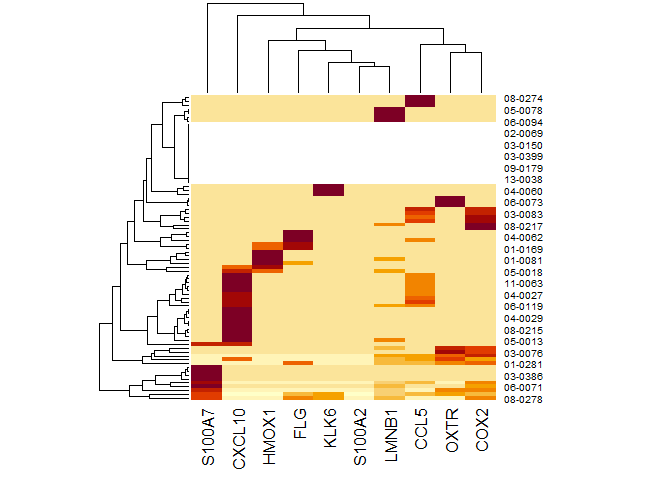
# Now we can plot it!
heatmap(mat)
Here I set all the NA to 0 to make distance computation and clustering possible, in your particular case you have to see if it's the right thing to do.