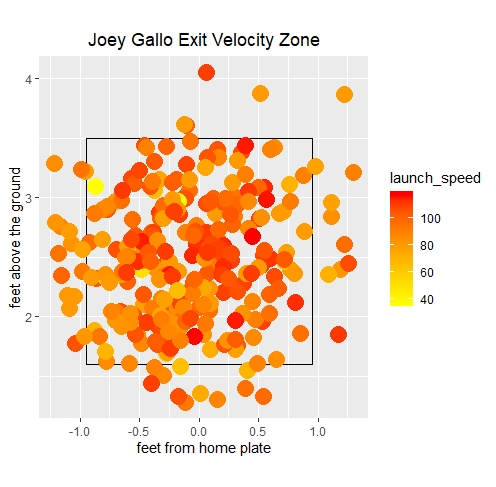
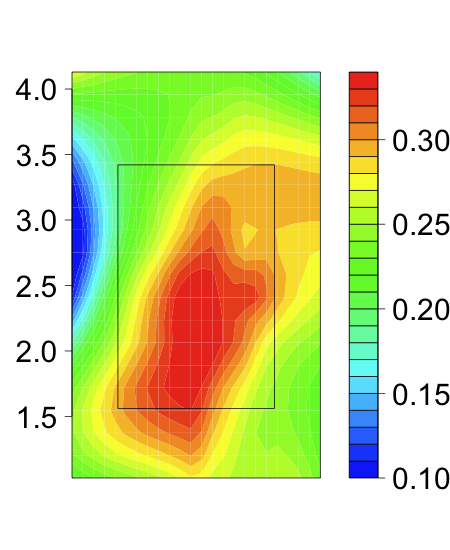
Hi, I asked a similar question yesterday. I was wondering what is the best heatmap package to recreate the second picture. I created the first one with ggplot, but I only used geom_point to get the points on the zone. Thank you.
mc_sz <- data.frame(
plate_x = c(-0.5162, -0.1094, -0.0202, -0.375, -0.1391, 0.1185, 0.4077,
0.7128, 0.0589, -0.3427, -1.0754, -0.3306, 0.298, -0.401,
-0.5379, 0.2722, 0.024, 0.2965, 0.1963, -0.8651, -0.3848,
-0.2714, -0.3146, -0.466, 0.0775, 0.4935, -0.1669, -0.3934,
0.531, -0.3034, -0.2168, -1.1668, 0.8119, -0.6022,
-0.6552, -0.7919, -0.1293, 0.0026, 0.7659, -0.1121, 1.1091,
1.1839, -1.2055, -1.0443, 0.2084, 0.0932, 0.3586, -0.4077,
0.0855, -0.3629),
plate_z = c(1.8485, 3.2795, 2.7635, 3.0621, 1.9443, 2.994, 1.5461,
2.8834, 2.511, 1.921, 2.6198, 2.8775, 2.8462, 2.7114,
2.6862, 2.474, 2.3153, 3.0147, 2.4259, 2.3212, 2.7084, 2.4436,
2.1572, 2.1046, 2.964, 1.6101, 2.8576, 2.6813, 1.9593,
1.5065, 2.1532, 2.7552, 2.1227, 2.2934, 2.3561, 2.3362,
2.9875, 2.0759, 2.9682, 2.7123, 2.8424, 2.3976, 2.7897, 2.17,
2.4886, 2.4325, 3.379, 3.0943, 2.0522, 2.4076),
launch_speed = c(84.6, 108.2, 91, 65.9, 92.3, 99.9, 69.3, 78.2, 110.9,
107.7, 82.9, 110.4, 91.3, 98.2, 103.5, 109.7, 107.3,
94.2, 102.5, 103.2, 109.5, 108.9, 89.2, 78.1, 109.8, 89.6,
110.5, 104.9, 109.5, 86.7, 99.4, 89.2, 113.3, 100.9, 80, 56.2,
109.5, 98.2, 91.8, 90.3, 84.2, 81.5, 81.6, 79.8, 107.5,
93.1, 107.1, 104, 96.1, 82)
)
ggplot() +
geom_path(data=sz, aes(x=x_sz, y=z_sz), size=1)+
coord_equal()+xlab("feet from home plate")+
ylab("feet above the ground")+
geom_point(data=mc_sz, aes(x=plate_x, y=plate_z, color=launch_speed), size=5.75)+
ggtitle("Joey Gallo Exit Velocity Zone")+ theme(plot.title = element_text(hjust = 0.5))+
scale_color_gradient(low="yellow", high="red")
x_sz <- c(-.95, .95, .95, -.95, -.95)
z_sz <- c(1.6, 1.6, 3.5, 3.5, 1.6)
sz <- data.frame(x_sz,z_sz)