Here is a sample of complete.tbl:
> dput(head(complete.tbl, n = 10))
structure(list(Size = c(167.676, 119.669, 979.046, 412.924, 828.349,
4340.66, 374.423, 15418.8, 2135.08, 7.66146), Group = c("Protists",
"Plants", "Plants", "Plants", "Plants", "Plants", "Plants", "Plants",
"Plants", "Fungi"), Genes = c("38549", "38311", "59906", "37734",
"31275", NA, "35223", NA, "49339", "3695"), GC = c("64.5", "36.0529",
"35.1153", "34.047", "35.6991", "44.5703", "43.5769", "46.113",
"46.9109", "27.8"), Status = c("Scaffold", "Chromosome", "Chromosome",
"Chromosome", "Chromosome", "Chromosome", "Chromosome", "Chromosome",
"Chromosome", "Contig"), SizeKb = c(NA_real_, NA_real_, NA_real_,
NA_real_, NA_real_, NA_real_, NA_real_, NA_real_, NA_real_, NA_real_
)), row.names = c(NA, -10L), class = c("tbl_df", "tbl", "data.frame"
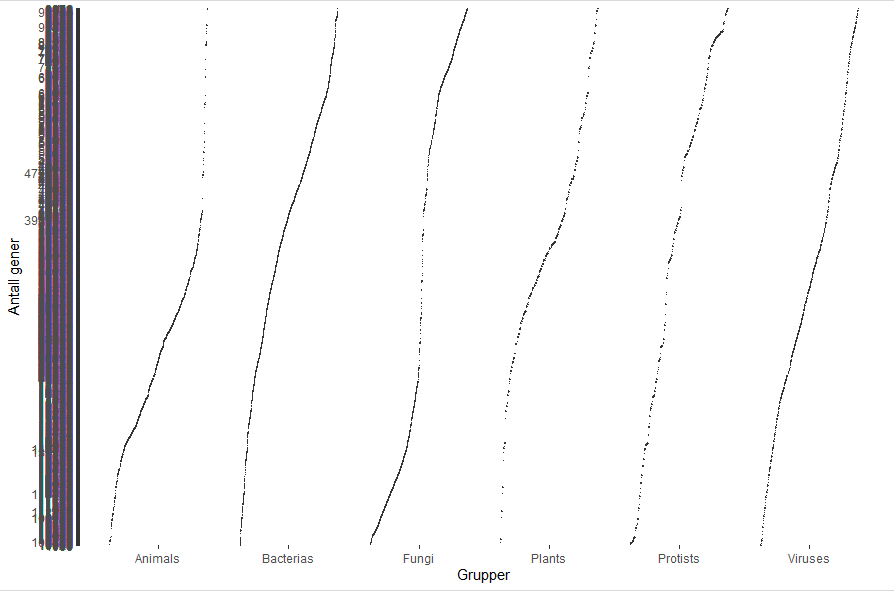
I used reorder() to sort the boxes in the plot by median.