Hi all!
I'm trying to create an application based on the climate change app in "show me shiny". URL to code - Climate-Change-1900-2014/Shiny_ClimateChange at master · OmaymaS/Climate-Change-1900-2014 · GitHub
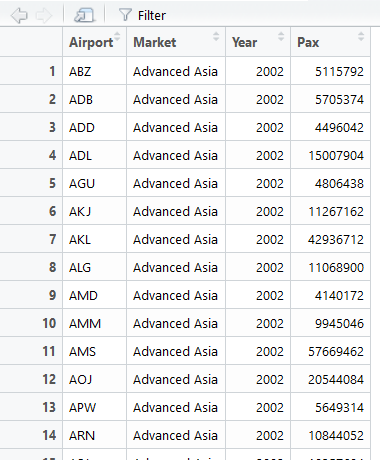
I've attached an image of how my data looks like - basically the ggplot is not responding to an user input at all and ive spent hours trying to work it out. Could anyone please have a look?
Here is my server input
#Load Libraries
library(shiny)
library(ggplot2)
library(dplyr)
library(purrr)
library(tidyr)
library(mgcv)
#Load data
shinyServer(function(input, output) {
output$overview<-renderText("Below are the passengers markets for the target airport")
#read the airport names (the unique values)
AirportNames<-unique(Passengers$Airport)
#Airports names list
output$AirportSelector<-renderUI({
selectInput('airport', 'Airport',
AirportNames,
multiple=TRUE,
selectize=TRUE,
selected="LHR") #default value
})
#Market abbreviation list
output$MarketSelector<-renderUI({
selectInput('market', 'Market',
set_names( 1:11,unique(Passengers$Market)),
multiple=TRUE,
selectize=TRUE,
selected=1:11) #default all
})
#get the selected airports
SelectedAirport<-reactive({
if(is.null(input$airport) || length(input$airport)==0)
  return()
as.vector(input$airport)
})
#get the selected market
SelectedMarket<-reactive({
if(is.null(input$market) || length(input$market)==0)
  return()
as.numeric(as.vector(input$market))
})
Passengersdf<-reactive({
Passengers %>%
filter(Airport %in% SelectedAirport()) %>%
filter(Market %in% SelectedMarket())
})
output$ff <- renderPrint({
names(airportsDF())
})
#get Check group input (type of plot)
checkedVal <- reactive({
as.vector(input$checkPlot)
})
###########plot#########
output$RegPlot<-renderPlot({
#check if airport and market are not null
if ((length(SelectedAirport())>0) && (length(SelectedMarket())>0))
{g<-ggplot(Passengersdf(),
           aes(x=Year,y=Pax,colour=factor(Market)))+
  labs(x="Year",
       y="Passengers")+
  scale_color_discrete(name="Market",
                       breaks=c(1:11),
                       labels=unique(Passengers$Market))

if ("GAM Plot" %in% checkedVal())

  g<-g+stat_smooth(method="gam", formula=y~s(x),se=FALSE)

if ("Point Plot" %in% checkedVal())

  g<-g+geom_point(aes(alpha=0.4))+
    guides(alpha=FALSE)

g
}
})
#########################
})
And here is my ui
#Load Libraries
library(shiny)
library(ggplot2)
library(dplyr)
#Define UI
shinyUI(fluidPage(
#Application title
titlePanel("MIDT Analysis"),
#Sidebar with controls to select airport, market and type of plot
sidebarLayout(
sidebarPanel(
  helpText("Type/Select one or more airports:"),

  uiOutput("AirportSelector"),

  helpText("Type/Select one or more markets:"),
  uiOutput("MarketSelector"),

  helpText("Select type of plot:"),
  checkboxGroupInput("checkPlot",
                     label = ("Plots"),
                     choices=c("GAM Plot","Point Plot"),
                     selected = "GAM Plot"
  ),

  helpText("Testing")

),

#Main Panel contains the plot/s
mainPanel(

  textOutput("overview"),
  plotOutput("RegPlot")
  # verbatimTextOutput("ff")


)
)
))