Hi there! Would appreciate some help regarding the interpretation of this particular plot from my data Thank You! ![]()
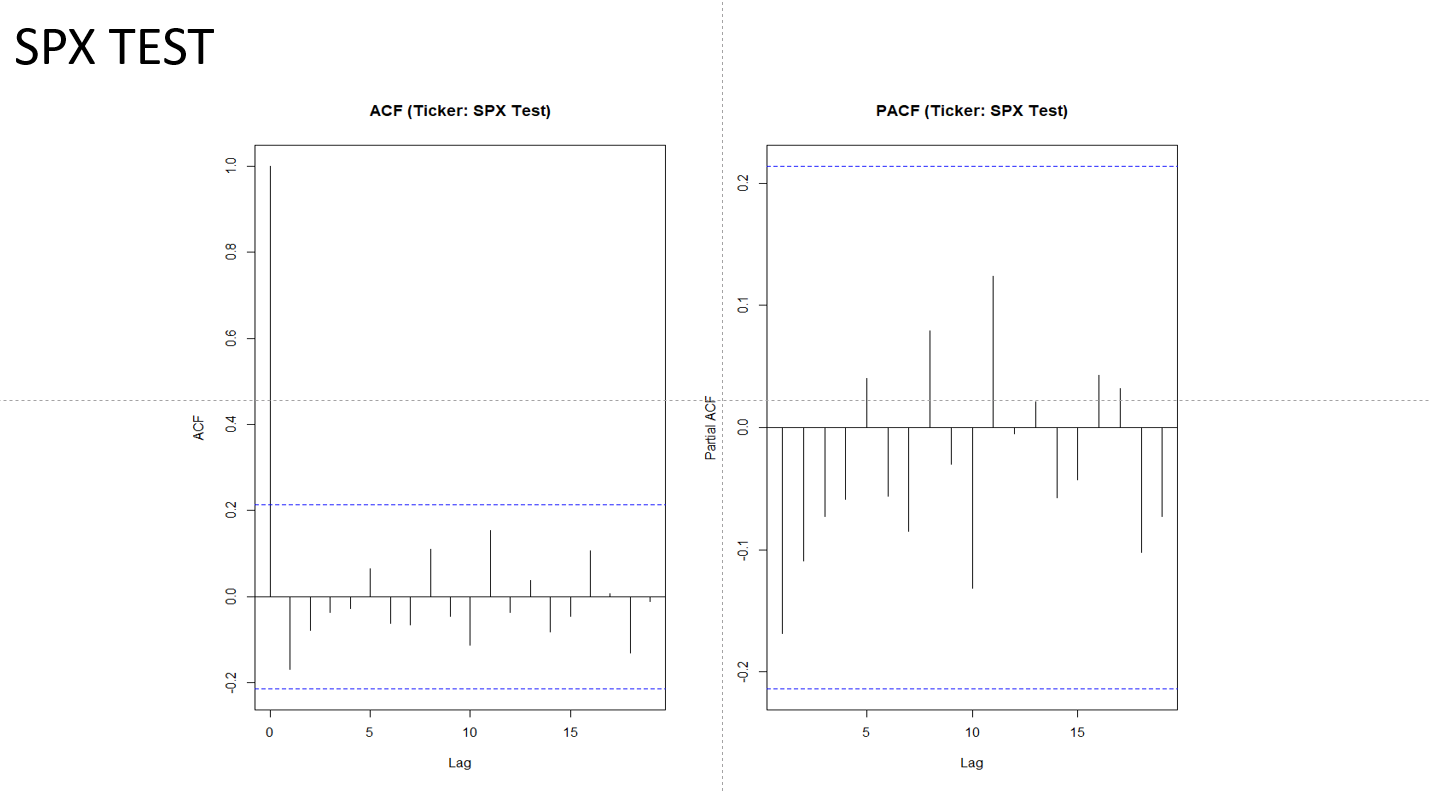
All of the ACF and PACF values, other than the ACF for a lag of zero, are not statistically significant (less than two standard deviations from zero, as shown by the dashed lines). This indicates that SPX Test is white noise (so both p and q are zero).
I believe that the ACF of 1.0 for a lag of 0 is the maximum possible value for ACF at all other lags, which just means that correlations with past values cannot be greater than 100%. It is not used to determine whether the data is AR or MA. The forecasting packages that I use do not include a zero lag in the ACF. What package did you use to generate the correlograms?
1 Like
Thank You for the help @EconProf!! ![]() For the package I didn't really used any but just simply the ACF() & PACF() functions to generate the correlograms just like the codes below
For the package I didn't really used any but just simply the ACF() & PACF() functions to generate the correlograms just like the codes below
acf(diff(log(train$SPX_Data.Close))
pacf(diff(log(train$SPX_Data.Close))
This topic was automatically closed 42 days after the last reply. New replies are no longer allowed.
If you have a query related to it or one of the replies, start a new topic and refer back with a link.