Having issues creating a map using ggplot

Hi, I am a beginner to rstudio trying to create a map of dallas using ggplot. I ran the code with no errors however, the output does not display the map. Instead the output looks the image I attached below.

I am unsure how to fix this, any help is appreciated, thank you!
Here is my code:

library(ggplot2)
library(maps)

# get dallas data
data <- map_data("county", "texas")
dallas_map <- subset(data, subregion == "dallas")

# display map
ggplot() +  geom_polygon(data = dallas_map, aes(x = long, y = lat, group = group), fill = "grey", color = "black")
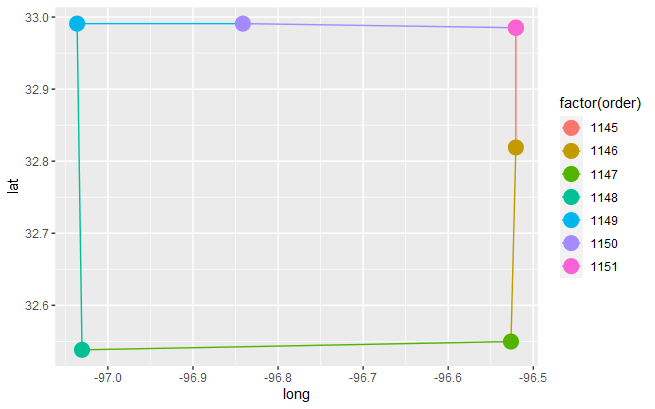
I think that just is a low poly representation of the area of dallas.

library(ggplot2)
library(maps)

# get dallas data
data <- map_data("county", "texas")
dallas_map <- subset(data, subregion == "dallas")

# display map
ggplot(data = dallas_map) +
  aes(x = long, y = lat, group = group, color = factor(order)) +
  geom_path()+
  geom_point(size=5)

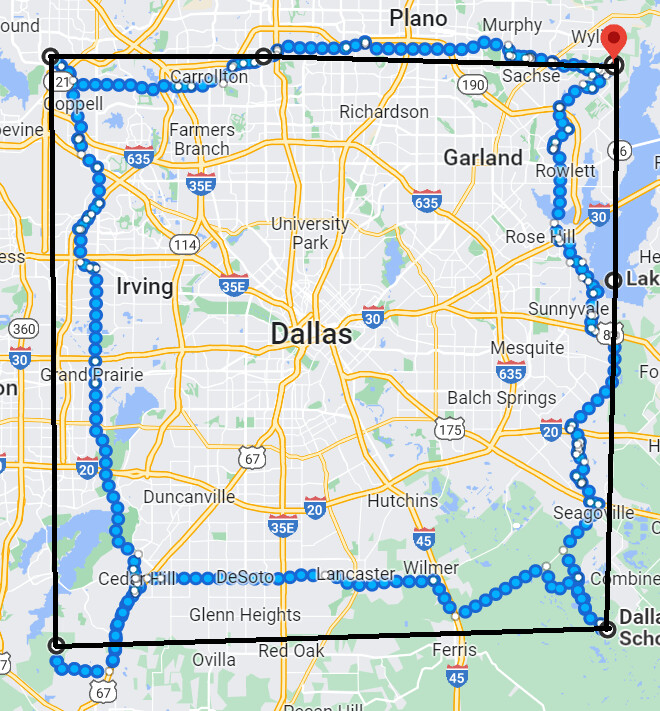
compare to when I drop the latitude and longditude into google maps
link

drawing over with black line tool in paint, from the plotted points from google maps :>>