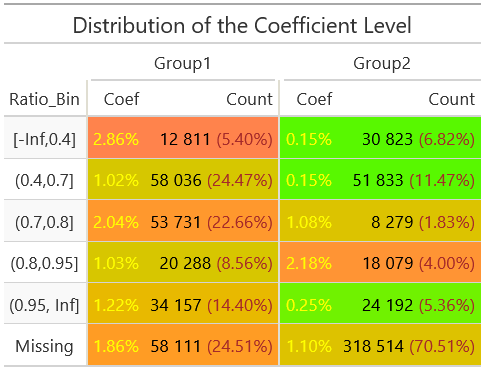
Sometimes, using the {gt} package, it is necessary to perform uniform formatting of columns in separate groups, often collecting them in pairs into single columns. For example, filling the background of a group of cells in one row with a specific color. Similar actions are sometimes required for groups of rows. For example, shading only the odd rows of one or more columns. Recall that the gt::opt_row_striping() function alternates rows with a light gray fill of all table columns.
It is more convenient to process homogeneous groups of columns or rows using the {purrr} package of functional programming tools. First, we perform I) automatic Pairwise merge of Columns into Pillars (gt::cols_merge_n_pct()), then II) change the font color of percentage values in Pillars, then III) coloring cell backgrounds by Column Groups gt::data_color(), and finally IV) shading the background of factor columns in odd rows .
library(purrr)
library(stringr)
library(gt)

df <- structure(list(Ratio_Bin = structure(c(1L, 2L, 3L, 4L, 5L, 7L
), levels = c("[-Inf,0.4]", "(0.4,0.7]", "(0.7,0.8]", "(0.8,0.95]",
              "(0.95, Inf]", "[0.95, Inf)", "Missing", "[-Inf,0.4)", "[0.4,0.7)",
              "[0.7,0.8)", "[0.8,0.95)"), class = c("ordered", "factor")),
`Group1|Coef` = c(0.0286, 0.0102, 0.0204, 0.0103, 0.0122, 0.0186),
`Group1|Count` = c(12811L, 58036L, 53731L, 20288L, 34157L, 58111L),
`Group1|Prop` = c(0.054, 0.2447, 0.2266, 0.0856, 0.144, 0.2451),
`Group2|Coef` = c(0.0015, 0.0015, 0.0108, 0.0218, 0.0025, 0.011),
`Group2|Count` = c(30823L, 51833L, 8279L, 18079L, 24192L, 318514L),
`Group2|Prop` = c(0.0682, 0.1147, 0.0183, 0.04, 0.0536, 0.7051)),
row.names = c(NA, -6L), class = "data.frame")

df |>
  gt::gt() |>
  gt::tab_header(title = 'Distribution of the Coefficient Level') |>
  gt::tab_spanner_delim(delim = '|') |>
  gt::fmt_percent(columns = tidyselect:::where(is.double)) |>
  gt::fmt_integer(columns = tidyselect:::where(is.integer), sep_mark = " ") |>
  # 1. Automatic Pairwise Merge of Columns into Pillars
  (\(gt_tbl) {
    # Getting lists of columns
    flg_cols <- gt:::dt_data_get(gt_tbl) |> dplyr::select(dplyr::ends_with('Coef')) |> names()
    pct_cols <- gt:::dt_data_get(gt_tbl) |> dplyr::select(dplyr::ends_with('Prop')) |> names()
    num_cols <- gt:::dt_data_get(gt_tbl) |> dplyr::select(tidyselect:::where(is.integer)) |> names()

    # Checking the number of columns
    if (length(num_cols) != length(pct_cols)) stop("The number of integer and percentage columns does not match")

    # Performing Functional Programming: Interactively Merge Pairs of Columns
    purrr::reduce2(
      .x = num_cols,
      .y = pct_cols,
      .f = \(tbl, num, pct) tbl |> gt::cols_merge_n_pct(col_n = num, col_pct = pct, autohide = TRUE),
      .init = gt_tbl
    ) |>
      gt::tab_style(
        style = cell_borders(sides = 'left', color = '#E0DED2', weight = gt::px(2)),
        locations = list(gt::cells_body(columns = flg_cols), gt::cells_column_labels(columns = flg_cols))
      )
  })() |>
  # 2. Change the font color of percentage values
  gt::text_transform(
    locations = gt::cells_body(columns = tidyselect:::where(is.integer)),  # Basic Column Types That Create Pillars
    fn = function(x) { stringr::str_replace(x, "\\((.*)\\)", paste0("<span style='color:brown'>(\\1)</span>")) } ) |>
  # 3. Coloring cell backgrounds by Column Groups
  (\(gt_tbl) {
    purrr::reduce(
      # Defining Column Groups
      .x = {
          colnames(gt:::dt_data_get(gt_tbl)) |>
          strsplit("\\|") |>
          sapply(`[`, 1) |>
          unique() |>
          lapply(function(prefix) {
            list(target_cols = grep(paste0("^", prefix, "\\|"), colnames(gt:::dt_data_get(gt_tbl)), value = TRUE))
          }) |>
          purrr::keep(\(x) length(x$target_cols) > 0)
      },
      # Performing Functional Programming: Coloring target cell backgrounds
      .f = \(table, grp) {
        gt::data_color(
          data = table,
          columns = grep("Coef$", grp$target_cols, value = TRUE),
          target_columns = grp$target_cols,
          palette = c('green', 'orange', 'coral'),
          domain = range(0, 0.03)
        )
      },
      .init = gt_tbl
    )
  })() |>
  # 4. Shading the background of factor columns in odd rows
  (\(gt_tbl) {
    # Determine the row numbers to be colored (e.g. odd rows)
    rows_to_highlight <- seq(1, nrow(gt:::dt_data_get(gt_tbl)), by = 2)

    gt::tab_style(gt_tbl,
                  style = list(gt::cell_fill(color = "#F9F9F9")),
                  locations = cells_body( columns = tidyselect:::where(is.factor),
                                          rows = rows_to_highlight ) # Alternating rows
    )
  })() |>
  gt::tab_style(
    style = gt::cell_text(color = 'yellow'),
    locations = gt::cells_body(columns = dplyr::ends_with('Coef'))
  ) |>
  gt::tab_options(quarto.disable_processing = TRUE)
The result is a table like this