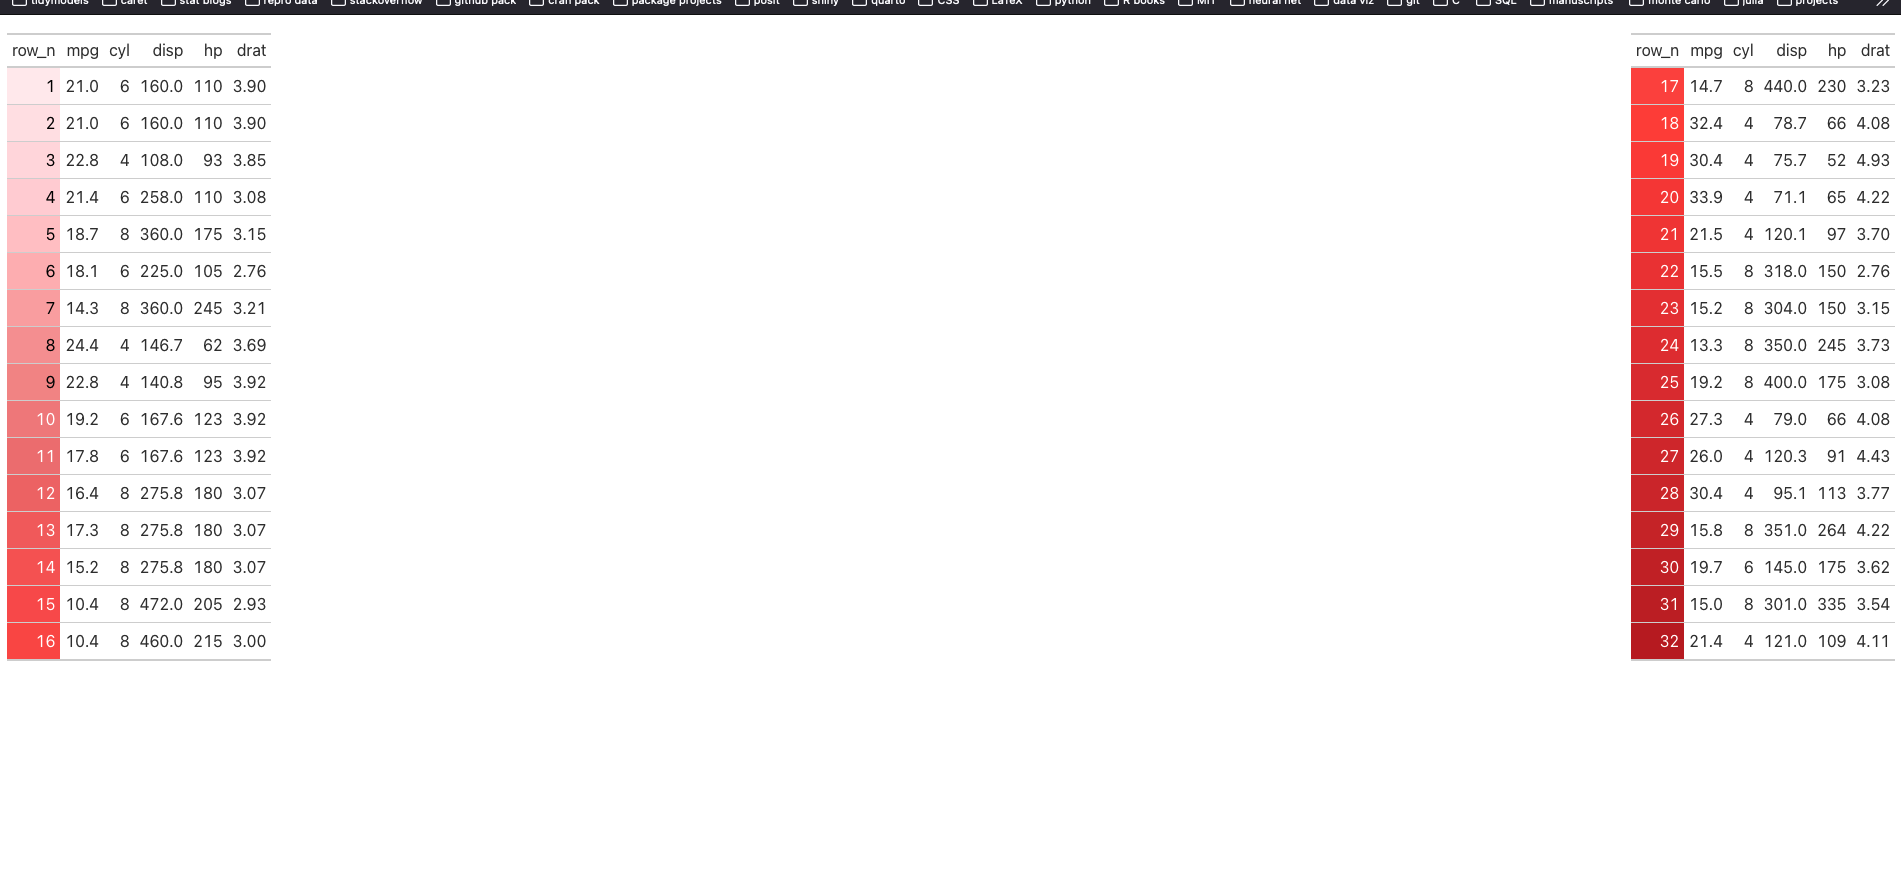
Regarding the tutorial below, has anyone actually figured out how to link the tables? And also add like features to it like an overall title, etc... The problem I'm having is that the output looks pretty absurd, see below. I included the code as well.
No, double_tables isn't an argument to gt_two_column_layout(). You need to REWRITE the gt_two_column_layout() function and make the changes I indicated.
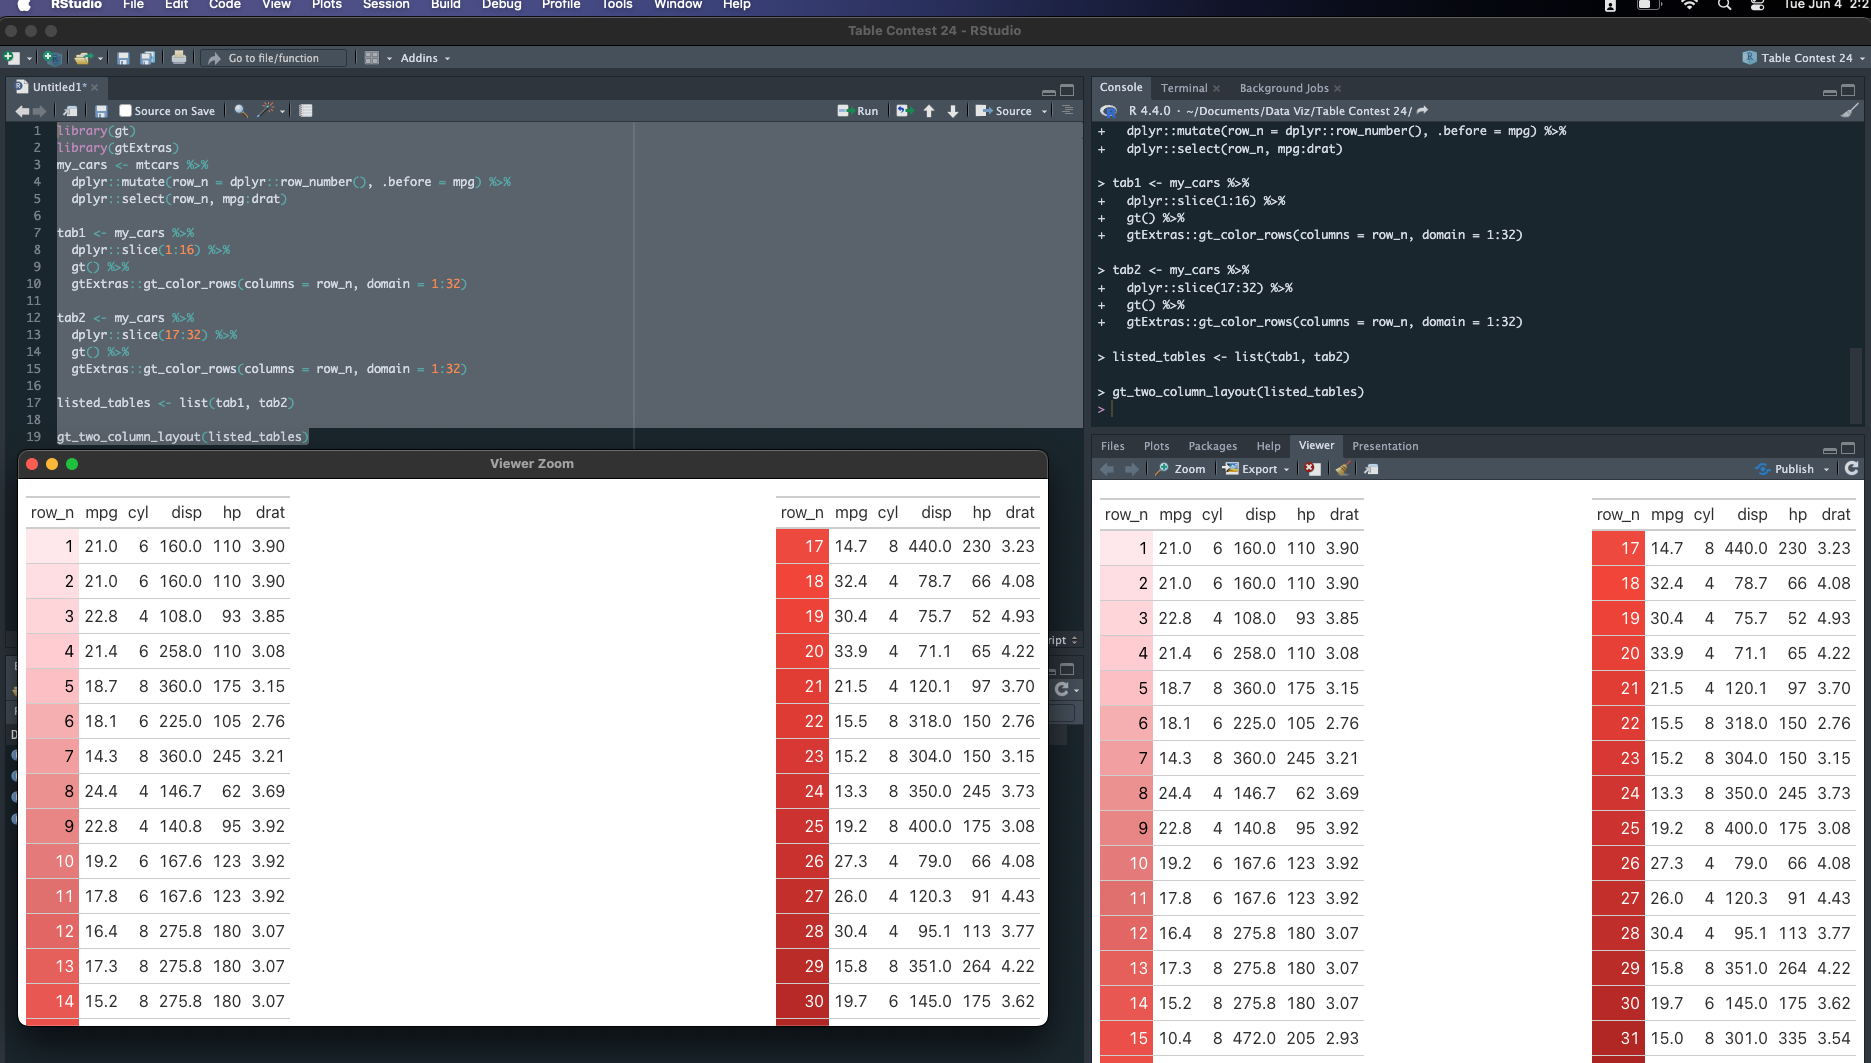
What steps did you take to produce the screenshot you shared? There is a black bar across the top that seems to show names (of files?) that have been cut off.
Yes, that's the code you used to create the plot, but the plot was rendered (made visible) to you in some way, for example in an RStudio "Plots" pane. Where did you render it? And did you change any window sizes before you took the screenshot you shared? The fact that there's a black strip above suggests you did more than simply run the code. Do you remember what you did?
I see we were writing at the same time — you just posted a screenshot that answers my question, so I've edited this post to reflect that.
@mduvekot : Since the output seems to be html, do you know if that means the inter-column spacing is at the mercy of how the viewer (meaning, user) decides to resize the browser window the output is rendered in (whether that window is part of RStudio or not)?
It's the width of the browser viewport that controls how part apart the two columns are. As I pointed out, you can make that space 0 by changing the float for both column to "left".