Grouped Violin Plot does not show fill by second IV

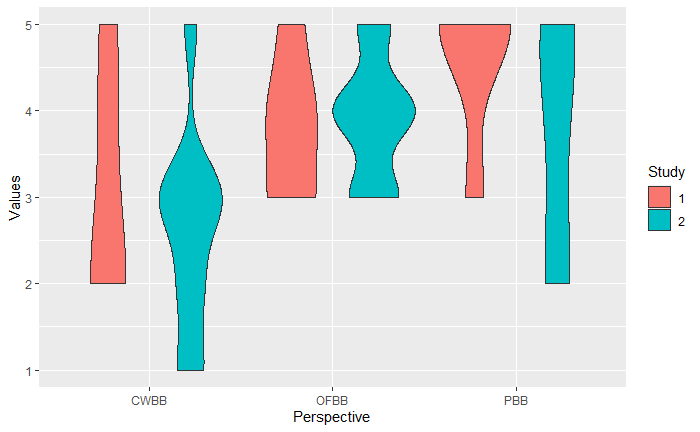
Hi, I'm very new to R and am trying to make a Grouped Violin Plot using this code that I have found others have recommended online:

data %>%
drop_na()%>%
ggplot(aes(x=Perspective,
y=Values,
fill=Study))+
geom_violin()

My "Study" variable is a binary variable with two options, representing two separate studies I have conducted. Whenever I run the code, I just get a black and white graph showing my x and y axis, no grouping variable. I think maybe it's because I have fewer observations (about 20 less participants) in one group (Study: 1) than I do in the other (Study: 2), but I'm not sure. Is there any way to get around this with unequal sample sizes, if this is indeed the problem?

Hi, can you provide a reproducible example of your data?

Hi williaml,

Here is my example dataframe

data.frame(
stringsAsFactors = FALSE,
Perspective = c("PBB","CWBB","OFBB","PBB",
"CWBB","OFBB","PBB","CWBB","OFBB","PBB","CWBB",
"OFBB","PBB","CWBB","OFBB","PBB","CWBB","OFBB","PBB",
"CWBB","OFBB","PBB","CWBB","OFBB","PBB","CWBB",
"OFBB","PBB","CWBB","OFBB","PBB","CWBB","OFBB","PBB",
"CWBB","OFBB","PBB","CWBB","OFBB","PBB","CWBB",
"OFBB","PBB","CWBB","OFBB"),
Values = c(5,4,5,5,2,4,5,2,4,3,5,
3,5,2,3,5,3,4,2,3,3,4,2,4,3,3,4,5,3,4,
2,3,3,5,1,5,2,2,3,4,1,4,5,5,5),
Study = c(1,1,1,1,1,1,1,1,1,1,1,
1,1,1,1,2,2,2,2,2,2,2,2,2,2,2,2,2,2,2,
2,2,2,2,2,2,2,2,2,2,2,2,2,2,2)
)

data <- data.frame(
stringsAsFactors = FALSE,
Perspective = c("PBB","CWBB","OFBB","PBB",
"CWBB","OFBB","PBB","CWBB","OFBB","PBB","CWBB",
"OFBB","PBB","CWBB","OFBB","PBB","CWBB","OFBB","PBB",
"CWBB","OFBB","PBB","CWBB","OFBB","PBB","CWBB",
"OFBB","PBB","CWBB","OFBB","PBB","CWBB","OFBB","PBB",
"CWBB","OFBB","PBB","CWBB","OFBB","PBB","CWBB",
"OFBB","PBB","CWBB","OFBB"),
Values = c(5,4,5,5,2,4,5,2,4,3,5,
3,5,2,3,5,3,4,2,3,3,4,2,4,3,3,4,5,3,4,
2,3,3,5,1,5,2,2,3,4,1,4,5,5,5),
Study = c(1,1,1,1,1,1,1,1,1,1,1,
1,1,1,1,2,2,2,2,2,2,2,2,2,2,2,2,2,2,2,
2,2,2,2,2,2,2,2,2,2,2,2,2,2,2)
)
data$Study <- as.factor(data$Study)

data %>%
drop_na()%>%
ggplot(aes(x=Perspective,y=Values,fill=Study))+
geom_violin()

2 Likes

So simple! Thanks so much for your help, M_AcostaCH!

This topic was automatically closed 7 days after the last reply. New replies are no longer allowed.

If you have a query related to it or one of the replies, start a new topic and refer back with a link.