I created a grouped box plot using ggplot2 package and now I want to re-create it using the tidyplots package. The reason is that I created another plot (stacked bar chart) where I used specific colors for the Scenarios (please see the attached image). The colors in the bar chart are tidyplots' default and now I want to use the same color to the box plot's scenarios (please see the attached image).
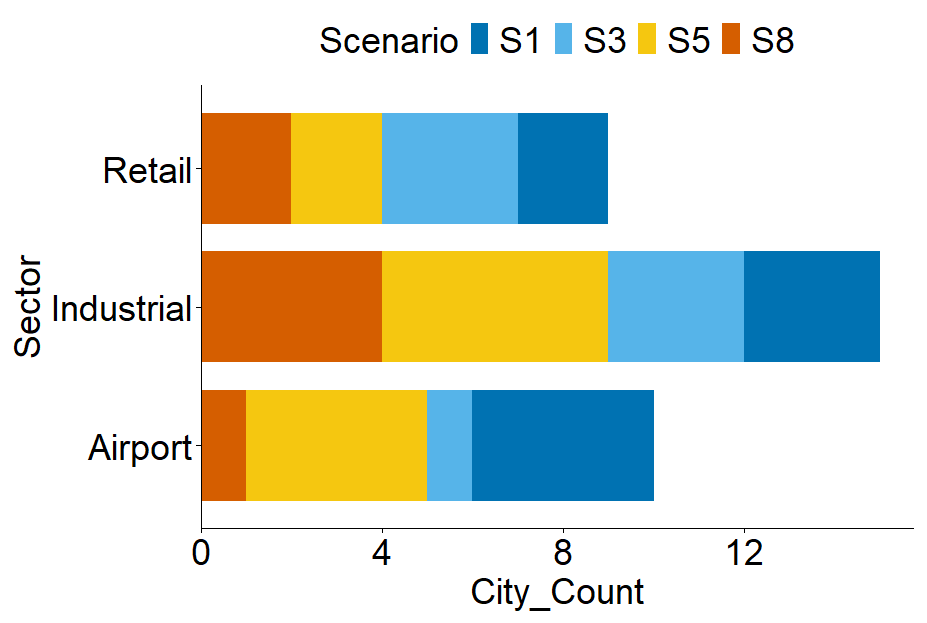
Stacked bar plot
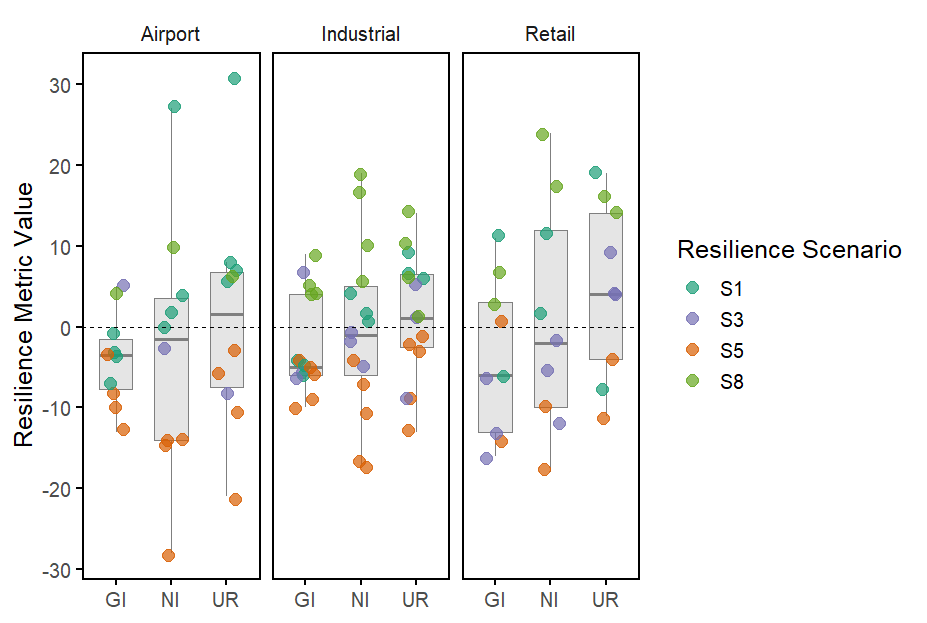
Grouped box plot
Below is the ggplot2 code for the box plot:
ggplot(combined_df, aes(x = Metric, y = Value, color = scenario)) +
  geom_boxplot(outlier.shape = NA, fill = "gray90", color = "gray50", width = 0.6) +
  geom_jitter(width = 0.2, size = 3, alpha = 0.7) +
  facet_wrap(~ Sector, nrow = 1) +
  scale_color_manual(values = scenario_colors) +
  geom_hline(yintercept = 0, linetype = "dashed", color = "black", linewidth = 0.3) +
  labs(
    title = NULL,
    subtitle = NULL,
    y = "Resilience Metric Value",
    x = NULL,
    color = "Resilience Scenario"
  ) +
  theme_minimal(base_size = 14) +
  theme(
    panel.grid = element_blank(),  # remove grid lines
    panel.border = element_rect(color = "black", fill = NA, linewidth = 0.8),  # add black border
    axis.line = element_line(color = "black", linewidth = 0.5),  # add axis lines
    axis.ticks = element_line(color = "black")  # optional: make tick marks black too
  )
The dataset:
> dput(combined_df)
structure(list(Sector = c("Retail", "Retail", "Retail", "Retail",
"Retail", "Retail", "Retail", "Retail", "Retail", "Retail", "Retail",
"Retail", "Retail", "Retail", "Retail", "Retail", "Retail", "Retail",
"Retail", "Retail", "Retail", "Retail", "Retail", "Retail", "Retail",
"Retail", "Retail", "Airport", "Airport", "Airport", "Airport",
"Airport", "Airport", "Airport", "Airport", "Airport", "Airport",
"Airport", "Airport", "Airport", "Airport", "Airport", "Airport",
"Airport", "Airport", "Airport", "Airport", "Airport", "Airport",
"Airport", "Airport", "Airport", "Airport", "Airport", "Airport",
"Airport", "Airport", "Industrial", "Industrial", "Industrial",
"Industrial", "Industrial", "Industrial", "Industrial", "Industrial",
"Industrial", "Industrial", "Industrial", "Industrial", "Industrial",
"Industrial", "Industrial", "Industrial", "Industrial", "Industrial",
"Industrial", "Industrial", "Industrial", "Industrial", "Industrial",
"Industrial", "Industrial", "Industrial", "Industrial", "Industrial",
"Industrial", "Industrial", "Industrial", "Industrial", "Industrial",
"Industrial", "Industrial", "Industrial", "Industrial", "Industrial",
"Industrial", "Industrial", "Industrial", "Industrial", "Industrial",
"Industrial", "Industrial"), Metric = c("UR", "UR", "UR", "UR",
"UR", "UR", "UR", "UR", "UR", "GI", "GI", "GI", "GI", "GI", "GI",
"GI", "GI", "GI", "NI", "NI", "NI", "NI", "NI", "NI", "NI", "NI",
"NI", "UR", "UR", "UR", "UR", "UR", "UR", "UR", "UR", "UR", "UR",
"GI", "GI", "GI", "GI", "GI", "GI", "GI", "GI", "GI", "GI", "NI",
"NI", "NI", "NI", "NI", "NI", "NI", "NI", "NI", "NI", "UR", "UR",
"UR", "UR", "UR", "UR", "UR", "UR", "UR", "UR", "UR", "UR", "UR",
"UR", "UR", "GI", "GI", "GI", "GI", "GI", "GI", "GI", "GI", "GI",
"GI", "GI", "GI", "GI", "GI", "GI", "NI", "NI", "NI", "NI", "NI",
"NI", "NI", "NI", "NI", "NI", "NI", "NI", "NI", "NI", "NI"),
    City = c("BA", "Johan", "LA", "SP", "Sydney", "Madrid", "Mexico",
    "NY", "Paris", "BA", "Johan", "LA", "SP", "Sydney", "Madrid",
    "Mexico", "NY", "Paris", "BA", "Johan", "LA", "SP", "Sydney",
    "Madrid", "Mexico", "NY", "Paris", "Cairo", "HK", "LA", "London",
    "Sydney", "Madrid", "Mexico", "Mumbai", "NY", "Tokyo", "Cairo",
    "HK", "LA", "London", "Sydney", "Madrid", "Mexico", "Mumbai",
    "NY", "Tokyo", "Cairo", "HK", "LA", "London", "Sydney", "Madrid",
    "Mexico", "Mumbai", "NY", "Tokyo", "BA", "Cairo", "HK", "Johan",
    "LA", "London", "SP", "Seoul", "Sydney", "Madrid", "Mexico",
    "Mumbai", "NY", "Paris", "Tokyo", "BA", "Cairo", "HK", "Johan",
    "LA", "London", "SP", "Seoul", "Sydney", "Madrid", "Mexico",
    "Mumbai", "NY", "Paris", "Tokyo", "BA", "Cairo", "HK", "Johan",
    "LA", "London", "SP", "Seoul", "Sydney", "Madrid", "Mexico",
    "Mumbai", "NY", "Paris", "Tokyo"), Value = c(19, -4, 14,
    9, -8, 4, 16, -11, 4, -6, -14, 3, -13, 11, -6, 7, 1, -16,
    12, -18, 17, -5, 2, -2, 24, -10, -12, 6, 7, -8, -21, -6,
    31, 8, -3, 6, -11, -1, -4, 5, -10, -8, -3, -7, -13, 4, -3,
    4, 2, -3, -28, -14, 27, 0, -15, 10, -14, 6, 1, 7, -9, -1,
    -13, 5, 1, 9, 14, 10, -9, 6, -2, -3, -4, -6, -6, -9, -4,
    -6, -6, 5, -5, 4, 9, 7, 4, -5, -10, 2, -5, 1, -17, -4, -17,
    -1, 6, 4, 17, 19, -2, 10, -7, -11), scenario = c("S1", "S5",
    "S8", "S3", "S1", "S3", "S8", "S5", "S3", "S1", "S5", "S8",
    "S3", "S1", "S3", "S8", "S5", "S3", "S1", "S5", "S8", "S3",
    "S1", "S3", "S8", "S5", "S3", "S1", "S1", "S3", "S5", "S5",
    "S1", "S1", "S5", "S8", "S5", "S1", "S1", "S3", "S5", "S5",
    "S1", "S1", "S5", "S8", "S5", "S1", "S1", "S3", "S5", "S5",
    "S1", "S1", "S5", "S8", "S5", "S1", "S3", "S1", "S5", "S5",
    "S5", "S3", "S8", "S1", "S8", "S8", "S3", "S8", "S5", "S5",
    "S1", "S3", "S1", "S5", "S5", "S5", "S3", "S8", "S1", "S8",
    "S8", "S3", "S8", "S5", "S5", "S1", "S3", "S1", "S5", "S5",
    "S5", "S3", "S8", "S1", "S8", "S8", "S3", "S8", "S5", "S5"
    )), class = c("tbl_df", "tbl", "data.frame"), row.names = c(NA,
-102L))
Session info:
R version 4.4.3 (2025-02-28 ucrt)
Platform: x86_64-w64-mingw32/x64
Running under: Windows 11 x64 (build 26100)

Matrix products: default

locale:
[1] LC_COLLATE=English_United States.utf8  LC_CTYPE=English_United States.utf8    LC_MONETARY=English_United States.utf8
[4] LC_NUMERIC=C                           LC_TIME=English_United States.utf8

attached base packages:
[1] stats     graphics  grDevices utils     datasets  methods   base

other attached packages:
 [1] ggrepel_0.9.6    scales_1.3.0     tidytext_0.4.2   tidyplots_0.2.2  ggpubr_0.6.0     ggbeeswarm_0.7.2 scico_1.5.0      ggthemes_5.1.0
 [9] ggtext_0.1.2     lubridate_1.9.4  forcats_1.0.0    stringr_1.5.1    purrr_1.0.4      readr_2.1.5      ggplot2_3.5.2    tidyverse_2.0.0
[17] tidyr_1.3.1      dplyr_1.1.4      tibble_3.2.1

loaded via a namespace (and not attached):
 [1] gtable_0.3.6       beeswarm_0.4.0     rstatix_0.7.2      lattice_0.22-7     tzdb_0.5.0         vctrs_0.6.5        tools_4.4.3
 [8] generics_0.1.3     janeaustenr_1.0.0  pkgconfig_2.0.3    tokenizers_0.3.0   Matrix_1.7-3       RColorBrewer_1.1-3 lifecycle_1.0.4
[15] compiler_4.4.3     farver_2.1.2       munsell_0.5.1      carData_3.0-5      vipor_0.4.7        SnowballC_0.7.1    Formula_1.2-5
[22] pillar_1.10.2      car_3.1-3          abind_1.4-8        tidyselect_1.2.1   stringi_1.8.7      labeling_0.4.3     grid_4.4.3
[29] colorspace_2.1-1   cli_3.6.4          magrittr_2.0.3     patchwork_1.3.0    utf8_1.2.4         broom_1.0.8        withr_3.0.2
[36] backports_1.5.0    timechange_0.3.0   ggsignif_0.6.4     hms_1.1.3          rlang_1.1.6        gridtext_0.1.5     Rcpp_1.0.14
[43] glue_1.8.0         xml2_1.3.8         rstudioapi_0.17.1  R6_2.6.1