Grouped barplots using ggplot

I have this dataset

month = c("Jan","Feb","Mar","Apr","May","Jun","Jul","Aug","Sep","Oct","Nov","Dec")
Purchase = c(110,120,60,84,66,92,32,53,77,100,48,79)
Sales = c(90,120,80,64,69,98,41,39,65,98,57,69)
df = data.frame(month, Purchase, Sales)

I want to have a grouped barplot of month vs Purchase and Sales. Basically x axis should be Month and Y axis should be count and in the barplot, I need to have Purchase and Sales grouped next to each other per month.

   #Code for single plot
ggplot(data=df,aes(y=Purchase, x=month)) + geom_bar(stat = "identity")
#But when I do this, the plot is not correct. 
ggplot(data=df,aes(y=Purchase, x=month,fill=Sales)) + geom_bar(stat="identity", position = "dodge")
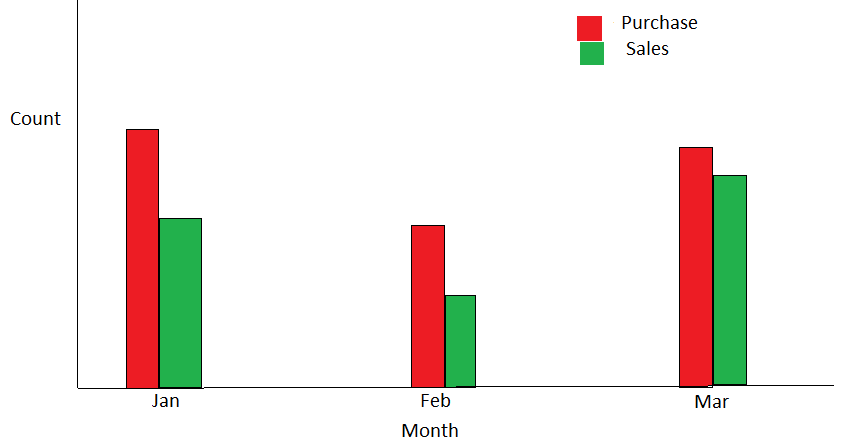
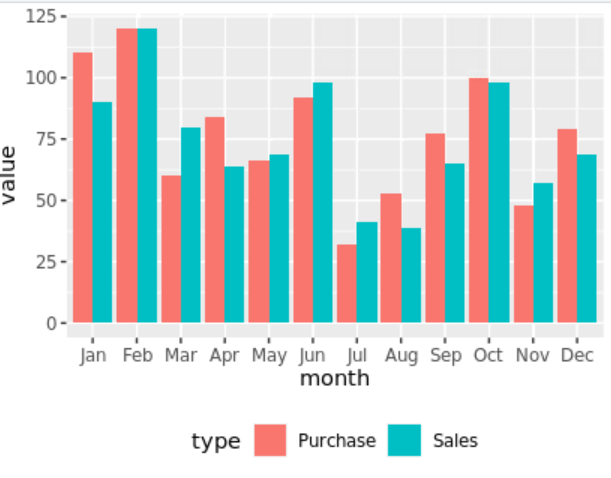
Something like this?

df2 <- df %>% 
  pivot_longer(-month, names_to = "type", values_to = "value") %>% 
  mutate(month = factor(month), levels = month.abb)

ggplot(df2, aes(month, value, fill = type)) +
  geom_col(position = "dodge") + 
  scale_x_discrete(limits = month.abb) +
  theme(legend.position = "bottom")

This is what I am looking for. But the issue is if I run the first line of code as is, I get "Error:Invalid index:out of bounds."
But this code works

df2 <- df %>%  pivot_longer(-month, names_to = "type", values_to = "value")
ggplot(df2, aes(month, value, fill = type)) + geom_col(position = "dodge") + 
  scale_x_discrete(limits = month.abb)

Edit: If I add mutate(month = factor(month)), I get the plot. I think levels=month.abb is causing "Out of bounds error".
The thing is irrespective of mutate, I get the pIot and see no difference in the result. I am not sure what mutate is doing.

It was meant to put the months in order, because it wasn't showing in the right order in my first graph. Good that it is working.