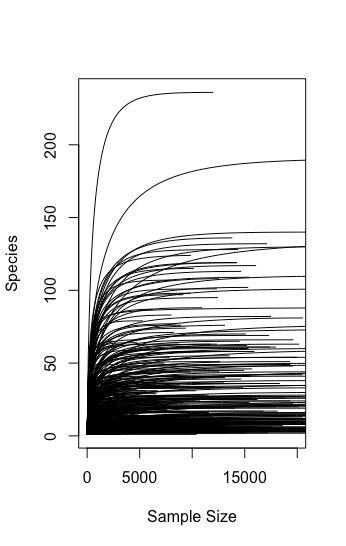
Hello. I am trying to figure out how to group samples based on metadata for rarefaction curves. I have a phyloseq object and I can get rarefaction curves for all the samples in my dataset by using:
Update - I figured it out by grouping my table before importation as a phyloseq object.
Now I have a different problem:
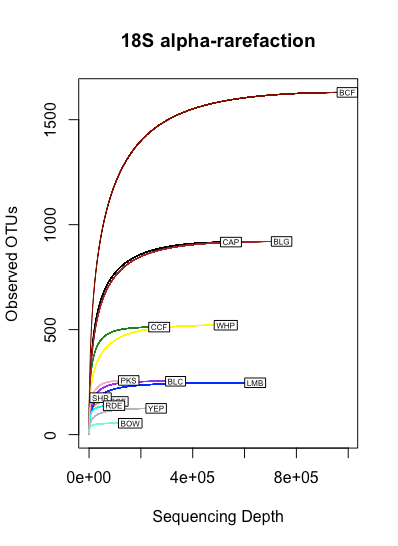
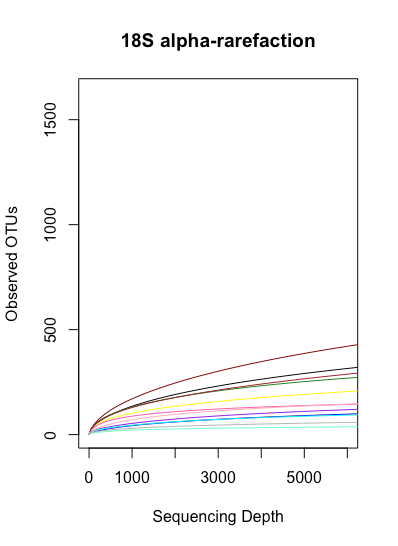
I noticed that when I set a limit on my rarefaction curves in order to zoom in, I lose the nice labels on the lines. They seem to only show if I let the graph go to completion.
Here is the graph to completion with labels: