group_by Time (class Period) hourly

Hi,
I'm new in R, and sorry in advance if my question is super simple.
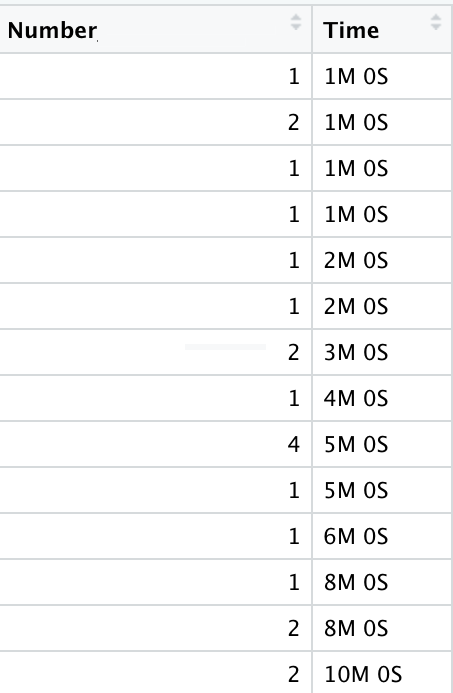
I am having difficulties grouping_by time hourly with the counts of the column(numbers). In my df Time column had initially "character" class, then I converted to "Period"

Apparently, I can't use group_by function for this class
Error in UseMethod("group_by") :
no applicable method for 'group_by' applied to an object of class "c('Period', 'Timespan', 'numeric', 'vector')"

See the FAQ: How to do a minimal reproducible example reprex for beginners for suggestions on posing questions more likely to attract quality answers. In R it always pays to begin with "what" before moving on to "how"?

The {lubridate} has good facilities for dealing with date times, so let's construct a toy data frame to see how you could make hourly time counts. The example below uses the analogous process of summarizing observations by day, since hourly data was easier to make up than by minute.

suppressPackageStartupMessages({
  library(dplyr)
  library(lubridate)
})
the_times = seq(
  from=as.POSIXct("2021-1-1 0:00", tz="UTC"),
  to=as.POSIXct("2021-1-11 15:00", tz="UTC"),
  by="hour")
the_data <- sample(1:6,256,replace = TRUE)

DF <- data.frame(observed = the_data, time_observed = the_times)
head(DF)
#>   observed       time_observed
#> 1        5 2021-01-01 00:00:00
#> 2        3 2021-01-01 01:00:00
#> 3        4 2021-01-01 02:00:00
#> 4        2 2021-01-01 03:00:00
#> 5        3 2021-01-01 04:00:00
#> 6        4 2021-01-01 05:00:00

DF %>% group_by(Day = day(the_times)) %>% summarise(Count = sum(observed))
#> # A tibble: 11 × 2
#>      Day Count
#>    <int> <int>
#>  1     1    81
#>  2     2    82
#>  3     3    81
#>  4     4    81
#>  5     5    83
#>  6     6    77
#>  7     7    85
#>  8     8    70
#>  9     9    80
#> 10    10    88
#> 11    11    64

Thank you very much for the answer. I have a data frame with number of cases happened in particular time during the day. So I wanted to group the number of cases hourly for 24 hours in order to display total number of cases every hour during the day in a line graph to the see whether there is a dependence with time.

See the FAQ: How to do a minimal reproducible example reprex for beginners. This question is harder to do in the abstract than if some representative data is included.

This topic was automatically closed 21 days after the last reply. New replies are no longer allowed.

If you have a query related to it or one of the replies, start a new topic and refer back with a link.