Am new in R Currently am working on R Markdown , i have data frame includes Aggregation column ( Total) i want to plot a table with multiple group by , and the statiscs shall be the sum for the total column , like pivot table Can you help
Am using R Markdown
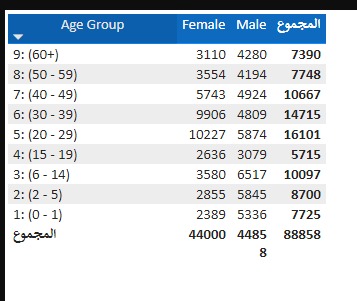
Expected result
The code i used :
df_1 <- OrPatientTotals %>%
filter(DomainID==1) %>%
group_by(DisplayEn) %>%
summarise(SumTransactions = sum(TotalTransactions))
A handy way to supply some sample data is the dput() function. In the case of a large dataset something like dput(head(mydata, 100)) should supply the data we need. Just do dput(mydata) where mydata is your data. Copy the output and paste it here between
```