I need to make the attached chart type. I can't see a proper ggplot2 chart type to match this. Maybe a bubble chart but fixed and squared ?
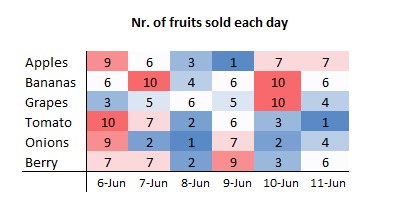
I am trying to do it with formattable, but I thought it would be a better solution somehow to use GGPLOT
The image shows a formatted table, so there's no need to use ggplot2.
However, if you really want to, then you could use geom_raster() or geom_tile()
Rectangles — geom_raster • ggplot2 (tidyverse.org)
and then add geom_text()
Text — geom_label • ggplot2 (tidyverse.org)
1 Like
Since it is easier for me with formattable i did with formattable. I will try this method thank you!
This topic was automatically closed 7 days after the last reply. New replies are no longer allowed.
If you have a query related to it or one of the replies, start a new topic and refer back with a link.