Apologies - I tried to understand and generate reprex but was unable. Will continue trying/learning. Instead, a sample of my script is below.
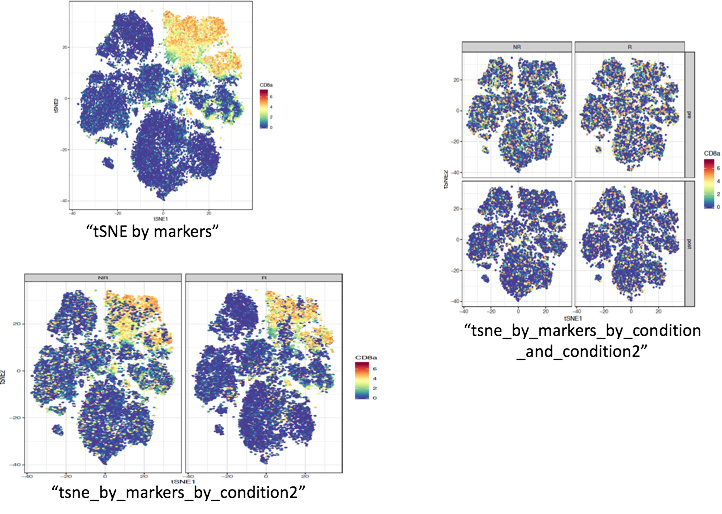
Excerpt is from a script used to analyze biological data through unsupervised clustering called tSNE (WorkFlow, Nowicka et al 2017). I am not inquiring about tSNE per se, but I am trying to generate graphs showing a gradient of protein expression (CD8 protein, for example; red is high, blue is low/zero). I can generate correct graphs without faceting, and with facet_wrap(~condition) or (~condition2) which are timepoint and drug response, respectively.
However, when I try to facet_wrap or facet_grid by both conditions, the CD8 expression is incorrect - the patterns of dk. blue and red are altered. Am I missing something or is there nothing to be done? With thanks...sample pictures also included below.
## Plot t-SNE colored by specific marker

dr <- data.frame(tSNE1 = tsne_out$Y[, 1], tSNE2 = tsne_out$Y[, 2],
expr[tsne_inds, lineage_markers])
dr$sample_id <- sample_ids[tsne_inds]
mm <- match(dr$sample_id, md$sample_id)
dr$condition <- md$condition[mm]
dr$condition2 <- md$condition2[mm]
dr$cell_clustering1 <- factor(cell_clustering1[tsne_inds], levels = 1:nmc)
## tSNE all markers separately (select only numeric data)

pdf(glue("./{out_dir}/tsne_by_markers.pdf"))
for (i in lineage_markers){
tsne_intensity<- ggplot(dr, aes(x = tSNE1, y = tSNE2, color = dr[,i])) +
geom_point(size = 1.0) +
theme_bw() +
scale_color_gradientn(i,
colours = colorRampPalette(rev(brewer.pal(n = 11, name = "Spectral")))(50))
print(tsne_intensity)
}
dev.off()
## tSNE all markers by condition and condition2

pdf(glue("./{out_dir}/tsne_by_markers_by_condition2.pdf"))
for (i in lineage_markers){
tsne_intensity<- ggplot(dr, aes(x = tSNE1, y = tSNE2, color = dr[,i])) +
facet_wrap(~ condition2) +
geom_point(size = 1.0) +
theme_bw() +
scale_color_gradientn(i,
colours = colorRampPalette(rev(brewer.pal(n = 11, name = "Spectral")))(50))
print(tsne_intensity)
}
dev.off()
## tSNE all markers by condition2

pdf(glue("./{out_dir}/tsne_by_markers_by_condition_and_condition2.pdf"))
for (i in lineage_markers){
tsne_intensity<- ggplot(dr, aes(x = tSNE1, y = tSNE2, color = dr[,i])) +
facet_grid(condition ~ condition2) +
geom_point(size = 1.0) +
theme_bw() +
scale_color_gradientn(i,
colours = colorRampPalette(rev(brewer.pal(n = 11, name = "Spectral")))(50))
print(tsne_intensity)
}
dev.off()