Thanks for the data. However for some reason I am having a problem reading it it. It looks like there are some strange characters in it. Also I do not understand why we are getting pure numeric character names.
I did some hand editing and I think I now have a clean version of the data set.
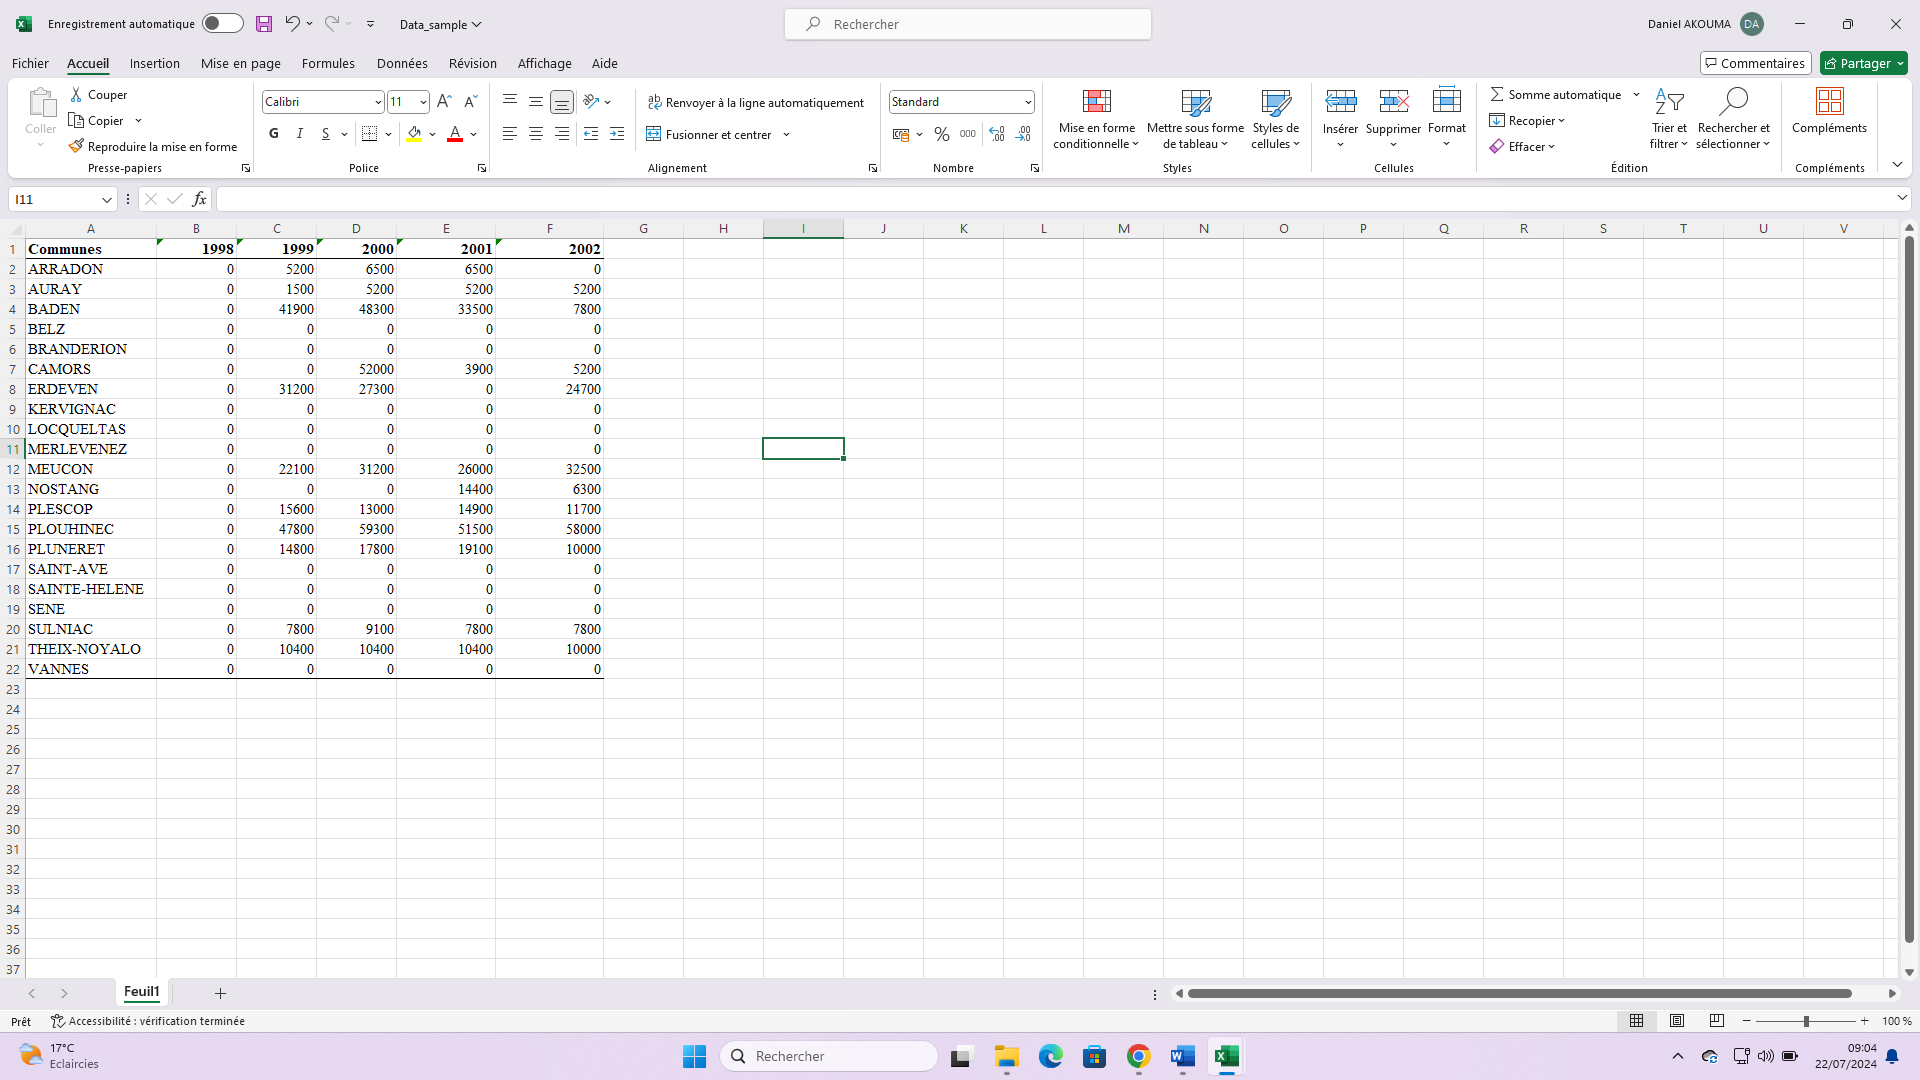
structure(list(Communes = c("ARRADON", "AURAY", "BADEN", "BELZ",
"BRANDERION", "CAMORS", "ERDEVEN", "KERVIGNAC", "LOCQUELTAS",
"MERLEVENEZ", "MEUCON", "NOSTANG", "PLESCOP", "PLOUHINEC", "PLUNERET",
"SAINT-AVE", "SAINTE-HELENE", "SENE", "SULNIAC", "THEIX-NOYALO",
"VANNES"), Y1998 = c(0, 0, 0, 0, 0, 0, 0, 0, 0, 0, 0, 0, 0, 0,
0, 0, 0, 0, 0, 0, 0), Y1999 = c(5200, 1500, 41900, 0, 0, 0, 31200,
0, 0, 0, 22100, 0, 15600, 47800, 14800, 0, 0, 0, 7800, 10400,
0), Y2000 = c(6500, 5200, 48300, 0, 0, 52000, 27300, 0, 0, 0,
31200, 0, 13000, 59300, 17800, 0, 0, 0, 9100, 10400, 0), Y2001 = c(6500,
5200, 33500, 0, 0, 3900, 0, 0, 0, 0, 26000, 14400, 14900, 51500,
19100, 0, 0, 0, 7800, 10400, 0), Y2002 = c(0, 5200, 7800, 0,
0, 5200, 24700, 0, 0, 0, 32500, 6300, 11700, 58000, 10000, 0,
0, 0, 7800, 10000, 0)), class = c("tbl_df", "tbl", "data.frame"
), row.names = c(NA, -21L))
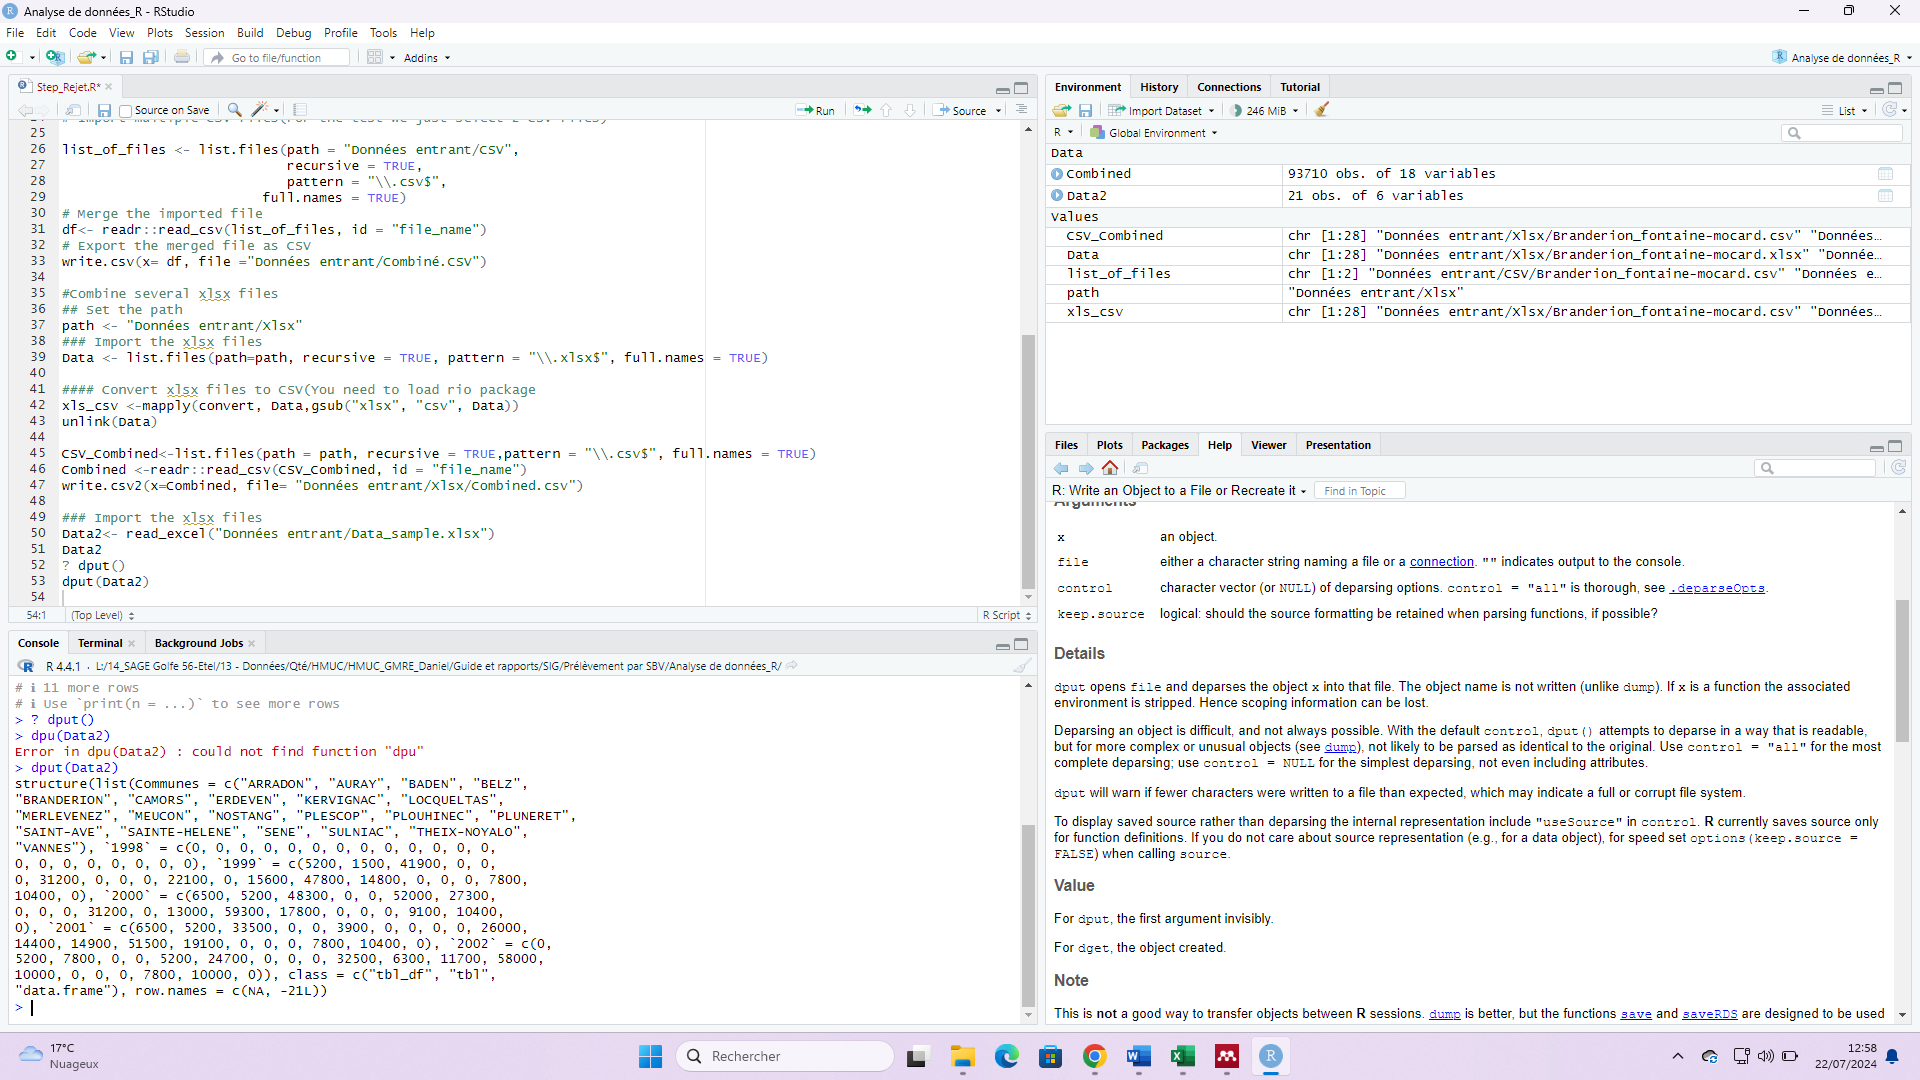
Reading code from a screen shot ins difficult . Could you copy the code and paste in here between
```
```
I think that ` is ALTGR + * on a AZERTY keyboard.