Hello everyone, I'm trying to make a graph with vectors, I found this code:
V = np.array([[1,1], [-2,2], [4,-7]])
origin = np.array([[0, 0, 0],[0, 0, 0]]) # origin point
plt.quiver(*origin, V[:,0], V[:,1], color=['r','b','g'], scale=21)
plt.show()
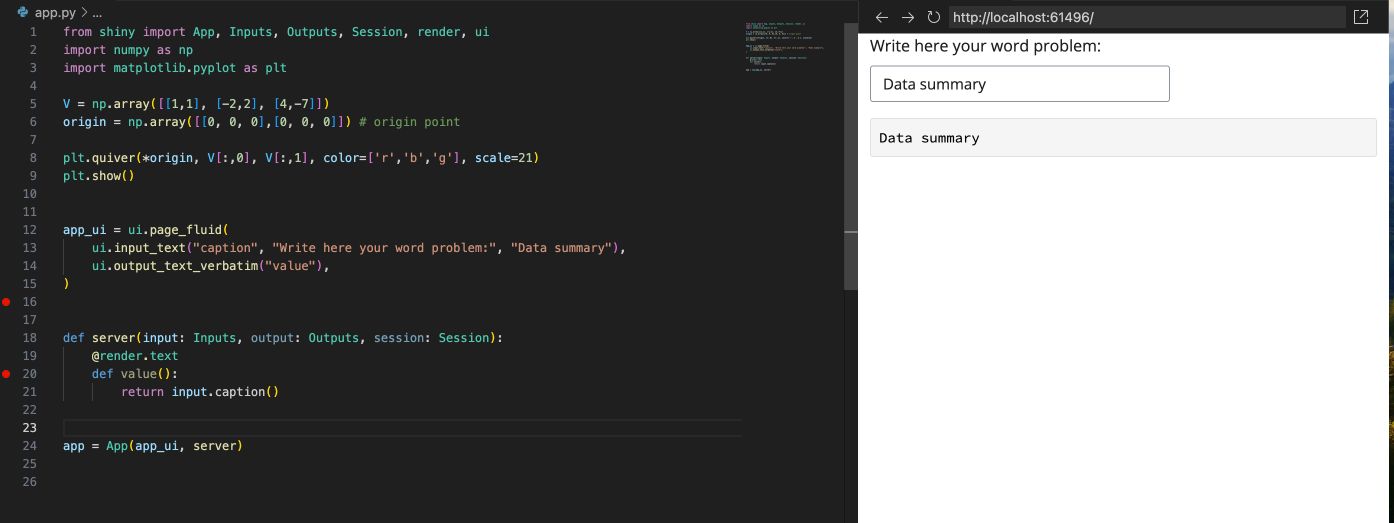
But I want it to be in the format of shiny, similar to this:
app_ui = ui.page_fluid(
ui.input_text("caption", "Write here your word problem:", "Data summary"),
ui.output_text_verbatim("value"),
)
def server(input: Inputs, output: Outputs, session: Session):
@render.text
def value():
return input.caption()
app = App(app_ui, server)
Can I receive some help? I'm very new. If I just input that in the code, it'll display an additional window with the vector plot as an image, I want it to be in the same browser than the other code together.