Hi all. I have a GLM that has 2 predictors: one is categorical and one is continuous. I'm trying to build a plot that shows the data point and the line based on predictors but I'm failing and I'm not sure why. Here's my code:
library(tidyverse)
library(ggplot2)
library(datapasta)
df <- data.frame(
VH_average = c(-18.4527033816948,
-16.2644305598873,-16.1847107297772,-16.1971205524948,
-16.5239874732068,-17.2211302093816,-18.2875256347705,
-13.7489056675713,-14.5000673290099,-15.4042266341501,-15.1817907735829,
-15.6276170790517,-18.3260089724533,-15.1530169022796,
-16.1034334250424,-15.8582055282567,-16.2250640523659,
-16.9422869158206,-17.5646332225128,-15.4220277527455),
temp = c(4.05,4.05,4.05,4.05,4.05,
4.05,7,7,7,7,7,7,4.9,4.9,4.9,4.9,4.9,4.9,5.7,
5.7),
rainfall_binary = as.factor(c("1","1","1",
"1","1","1","1","1","1","1","1","1",
"1","1","1","1","1","1","0","0"))
)
# make model
GLM.REPREX <- glm(data=df, VH_average~rainfall_binary+temp)
summary(GLM.REPREX)
#>
#> Call:
#> glm(formula = VH_average ~ rainfall_binary + temp, data = df)
#>
#> Deviance Residuals:
#> Min 1Q Median 3Q Max
#> -2.8263 -0.4344 0.2850 0.6205 1.7124
#>
#> Coefficients:
#> Estimate Std. Error t value Pr(>|t|)
#> (Intercept) -19.1081 1.5446 -12.371 6.31e-10 ***
#> rainfall_binary1 0.4357 0.8940 0.487 0.6322
#> temp 0.4587 0.2269 2.021 0.0593 .
#> ---
#> Signif. codes: 0 '***' 0.001 '**' 0.01 '*' 0.05 '.' 0.1 ' ' 1
#>
#> (Dispersion parameter for gaussian family taken to be 1.425065)
#>
#> Null deviance: 30.170 on 19 degrees of freedom
#> Residual deviance: 24.226 on 17 degrees of freedom
#> AIC: 68.592
#>
#> Number of Fisher Scoring iterations: 2
#create predictor variables
newRAIN <- crossing(temp = seq(0, 20, length = 100),
rainfall_binary = levels(factor(df$rainfall_binary)))
preds.matrix.VH <- predict(GLM.REPREX, newdata = newRAIN, se.fit = TRUE)
preds.RAIN <- bind_cols(newRAIN, as_tibble(preds.matrix.VH))
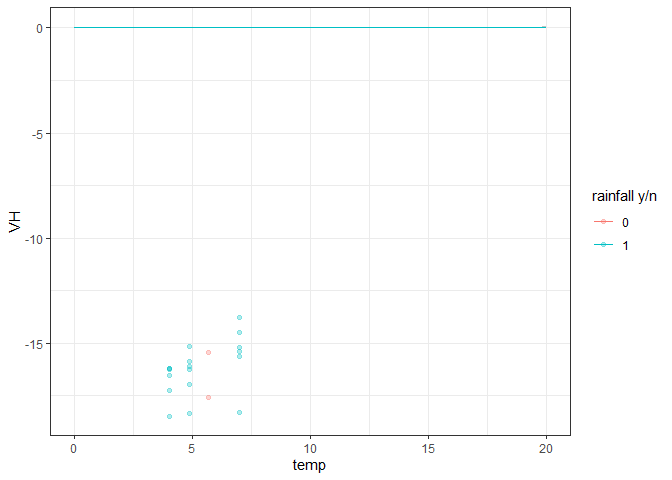
# plot
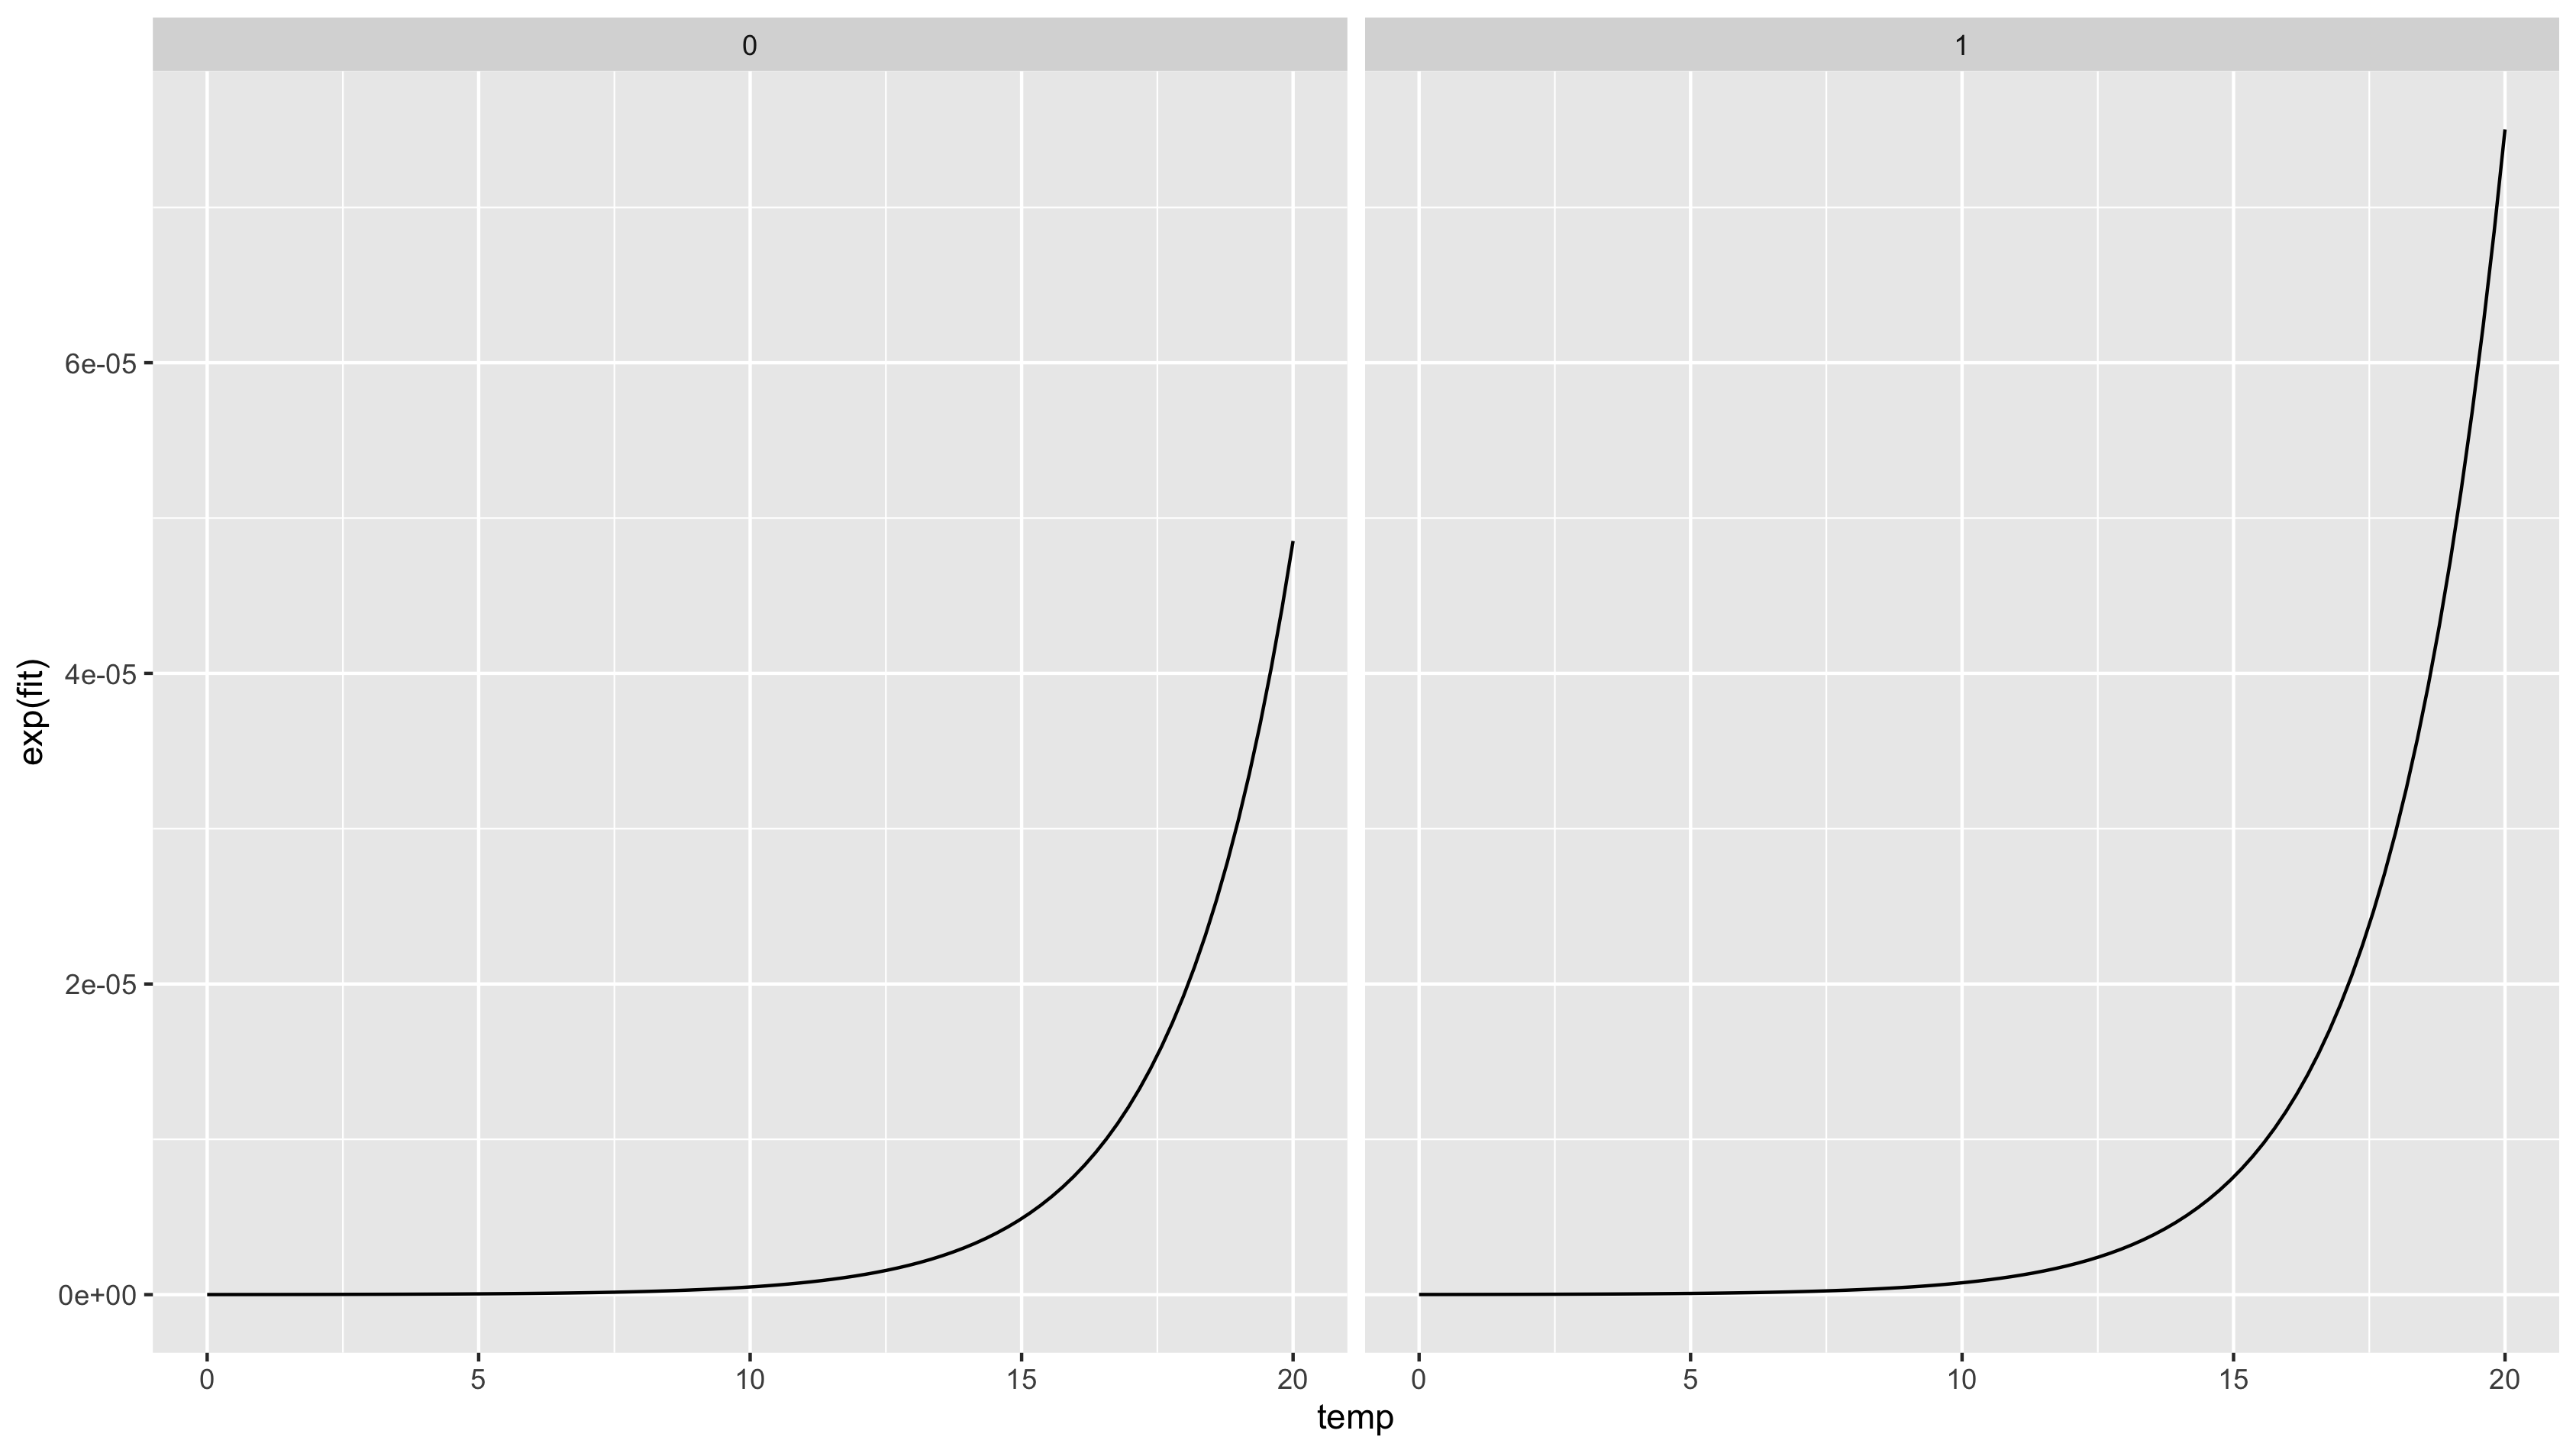
preds.RAIN %>%
ggplot(aes(x = temp, y = exp(fit))) +
geom_line(aes(colour = rainfall_binary)) +
geom_ribbon(aes(
ymax = exp(fit + 1.96 * se.fit),
ymin = exp(fit - 1.96 * se.fit),
group = rainfall_binary
),
alpha = 0.3) +
geom_point(data = df,
aes(y = VH_average,
colour = rainfall_binary),
alpha = 0.3) +
ylab("VH") +
xlab("temp") +
scale_color_discrete(name = "rainfall y/n") +
theme_bw()
Created on 2020-03-25 by the reprex package (v0.3.0)
Any suggestion is greatly appreciated!!
Thanks