ggraph: Map node point/text size to data

Hi all,

I'm working on creating a network diagram using igraph and ggraph. I would like to map the size of the node text labels and/or points back to the data. Here's some fake data to illustrate the point.

library(tidyverse)

words <- c("one", "two", "three", "four")
probs <- c(0.1, 0.2, 0.3, 0.4)

set.seed(99)

raw <- tibble(
    word1 = sample(words, 500, TRUE, prob = probs),
    word2 = sample(words, 500, TRUE, prob = probs)
)

counts <- count(raw, word1, word2, sort = TRUE)

head(counts)
#> # A tibble: 6 x 3
#>   word1 word2     n
#>   <chr> <chr> <int>
#> 1 four  four     81
#> 2 three four     65
#> 3 four  three    62
#> 4 two   four     49
#> 5 four  two      36
#> 6 three three    34

The parallel in "base" ggplot2 would be to set the size aesthetic with aes(size = n). Here's my set up for the network diagram.

library(igraph)
library(ggraph)

counts %>%
    graph_from_data_frame() %>%
    ggraph(layout = "fr") +
    geom_edge_link(
        aes(edge_alpha = n),
        arrow = grid::arrow(type = "closed", length = unit(0.15, "inches")),
        show.legend = FALSE
    ) +
    geom_node_point() +
    geom_node_text(
        aes(label = name),
        vjust = 1,
        hjust = 1
    ) +
    theme_void()
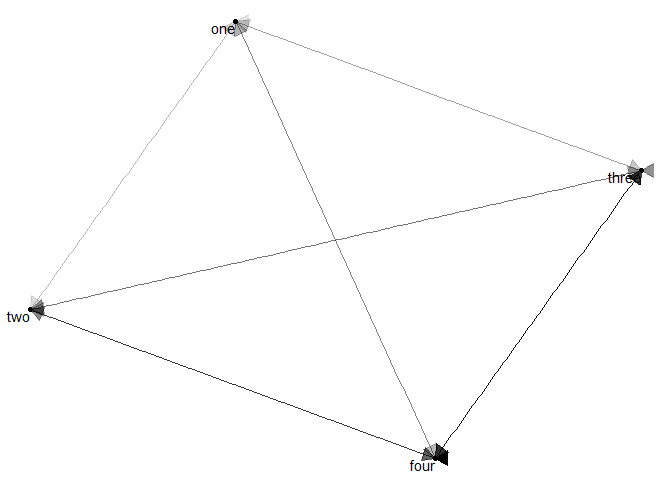
image

The edge_alpha aesthetic can be mapped to n, however, when I go to set size aesthetics, it throws an error. I'm having a tough time deciphering this and finding a potential solution in the documentation. Under the documentation for geom_node_point it says that the function understands the size aesthetic.

counts %>%
    graph_from_data_frame() %>%
    ggraph(layout = "fr") +
    geom_edge_link(
        aes(edge_alpha = n),
        arrow = grid::arrow(type = "closed", length = unit(0.15, "inches")),
        show.legend = FALSE
    ) +
    
    # -- map point size to data --
    geom_node_point(aes(size = n)) +
    geom_node_text(
        aes(label = name),
        vjust = 1,
        hjust = 1
    ) +
    theme_void()
#> Don't know how to automatically pick scale for object of type function. Defaulting to continuous.
#> Error: Column `size` must be a 1d atomic vector or a list

I'm not savvy as to what the data structure is after graph_from_data_frame() is called, but perhaps this is where I'm going wrong? Or maybe there's a different aesthetic to set the size which I'm unaware of?

Thanks in advanced for the help!

So there are a few things going on here that make tracing the problem a bit tricky. One is that n is both a name of a variable in your data frame and the name of a function, n(). The second is inherent to a graph, though you have an edge for each n in your data, there is more than one data point related to each node. So, if I make things more explicit in the code and say I want the node size to be the value of n I have too many values for each node, and I get an error.

I have four nodes, so it only wants four values for n.

library(tidyverse)
library(igraph, warn.conflicts = FALSE)
library(ggraph, warn.conflicts = FALSE)

words <- c("one", "two", "three", "four")
probs <- c(0.1, 0.2, 0.3, 0.4)

set.seed(99)

raw <- tibble(
  word1 = sample(words, 500, TRUE, prob = probs),
  word2 = sample(words, 500, TRUE, prob = probs)
)

counts <- count(raw, word1, word2, sort = TRUE)

graph_from_data_frame(counts) %>%
  ggraph(layout = "fr") +
  geom_edge_link(
    aes(edge_alpha = n),
    arrow = grid::arrow(type = "closed", length = unit(0.15, "inches")),
    show.legend = FALSE
  ) +
  geom_node_point(size = counts$n) +
  geom_node_text(
    aes(label = name),
    vjust = 1,
    hjust = 1
  ) +
  theme_void()
#> Error: Aesthetics must be either length 1 or the same as the data (4): size

Created on 2018-12-17 by the reprex package (v0.2.1.9000)

So, the question then becomes, what do you want the value mapped to each node to be?

Aha! This makes sense, I was equivocating edges and nodes... makes sense that they are of different lengths. Good point on watching out for how n is being interpreted, will keep an eye out for that.

So I suppose when setting the size aesthetic I could pass along a vector of total (rather than pairwise) frequencies if I wanted to scale the points or text by the data. Looks like feeding that vector works, will just need to make sure it's in the same order of the data behind graph_from_data_frame(),

Thanks, @mara!

1 Like

This topic was automatically closed 7 days after the last reply. New replies are no longer allowed.