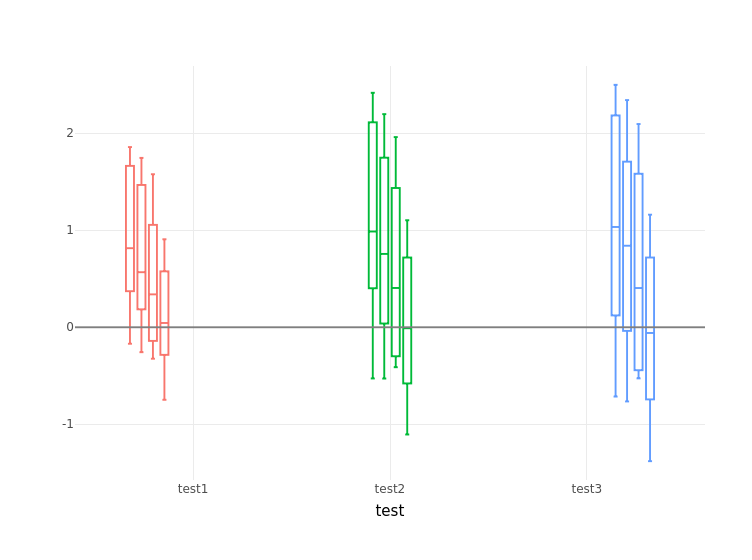
ggplotly reduces the size of geom_box and remove allignment
#minimal example
library(ggplot2)
library(plotly)
#>
#> Attaching package: 'plotly'
#> The following object is masked from 'package:ggplot2':
#>
#> last_plot
#> The following object is masked from 'package:stats':
#>
#> filter
#> The following object is masked from 'package:graphics':
#>
#> layout
example <- data.frame(group = c("A", "A", "A", "B", "B", "B", "C", "C", "C", "D", "D", "D","A", "A", "A", "B", "B", "B", "C", "C", "C","D", "D", "D", "A", "A", "A", "B", "B", "B", "C","C", "C", "D","D", "D", "A", "A", "A", "B", "B", "B", "C", "C", "C", "D", "D","D", "A", "A", "A","B", "B", "B", "C", "C", "C", "D", "D", "D", "A", "A", "A", "B", "B", "B", "C", "C", "C", "D", "D","D", "A", "A", "A", "B", "B", "B", "C", "C", "C", "D", "D", "D", "A", "A", "A", "B", "B", "B","C", "C", "C", "D", "D", "D", "A", "A", "A", "B", "B", "B", "C", "C", "C", "D", "D", "D", "A","A", "A", "B", "B", "B", "C", "C", "C", "D", "D", "D"), test = c("test1", "test2", "test3","test1", "test2", "test3", "test1", "test2", "test3", "test1", "test2", "test3", "test1","test2", "test3", "test1", "test2", "test3", "test1", "test2", "test3", "test1", "test2", "test3","test1", "test2", "test3", "test1", "test2", "test3", "test1", "test2", "test3", "test1","test2", "test3", "test1", "test2", "test3", "test1", "test2", "test3", "test1", "test2", "test3","test1", "test2", "test3", "test1", "test2", "test3", "test1", "test2", "test3", "test1","test2", "test3", "test1", "test2", "test3", "test1", "test2", "test3", "test1", "test2", "test3","test1", "test2", "test3", "test1", "test2", "test3", "test1", "test2", "test3", "test1","test2", "test3", "test1", "test2", "test3", "test1", "test2", "test3", "test1", "test2", "test3","test1", "test2", "test3", "test1", "test2", "test3", "test1", "test2", "test3", "test1","test2", "test3", "test1", "test2", "test3", "test1", "test2", "test3", "test1", "test2", "test3","test1", "test2", "test3", "test1", "test2", "test3", "test1", "test2", "test3", "test1","test2", "test3"), value = c(1.8261735564499, 2.41469304695392, 2.49664338672934, 1.74453274860897, 2.14980735930169, 2.18737658324276, 1.27822602057406, 1.61333936020613, 1.62467400082885, 0.575904223576653, 0.810169234840085, 0.839329237173878, 1.85560100112182, 2.28260740601392, 2.34683835705103, 1.46550488256854, 1.7461884584571, 1.7053887934041, 1.57605467149127, 1.95853271729617, 2.09294670422082, 0.906285831977355, 1.10235145391268, 1.15940792291179, 0.547973070844139, 0.40172624943061, 0.121991275220876, 0.0641026494964776, -0.233647372901781, -0.493333698970323, -0.140273680399528, -0.298514350764602, -0.442099404927235, -0.473538773215895, -0.728679752789217, -1.02986237177984, -0.169679486876371, -0.527141369750167, -0.713597303083518, -0.256734484361215, -0.528181691918756, -0.763747826662998, -0.323810135890746, -0.403087721614461, -0.470909393521824, -0.746822374601508, -1.10420563080096, -1.37887863809426, 0.371556443261412, 0.497675400445923, 0.428339263930057, 0.428687725723844, 0.500315995897347, 0.497583053623161, 0.181916904484455, 0.141272963839821, 0.145873518550901, -0.283980806814804, -0.578443819841852, -0.742677993311062, 1.19205967091164, 1.57291321602325, 1.86864927823783, 0.394657779958292, 0.665512025043185, 0.850179466292798, 0.0564675653436982, 0.195853456500564, 0.258772545130027, -0.271630860382564, -0.198116456393946, -0.177108518789399, 0.864873581658777, 1.05408840938552, 1.07292329965773, 0.705270150238122, 0.845433049650288, 0.829186856866134, 0.495646057929196, 0.613328949797516, 0.5496887368582, 0.188780242644911, 0.107073743397567, 0.0580085194425285, 0.263824075678554, 0.183652550797277, 0.113431511135591, 0.184630358035106, 0.0385399731595245, -0.0371251939241627, -0.145748762848051, -0.41131939028004, -0.526320452190415, -0.100426662054291, -0.126845338846333, -0.175231045472625, 1.66189525836125, 2.1104370260989, 2.18117327382258, 1.66395912917743, 2.19467349333439, 2.3393572221325, 1.05445454300104, 1.4341079940041, 1.58081135224651, 0.641310948204788, 0.718042811849002, 0.718211751962604, 0.763731915081846, 0.918088742469113, 0.992671965347885, 0.788815893737847, 0.89635591754048, 0.897912735401765, 0.63098225929166, 0.72263561766897, 0.768073625713823, 0.489412913021336, 0.561754686189859, 0.532039575639074))
example$id <- c("id1", "id1","id1", "id1", "id1", "id1", "id1", "id1", "id1", "id1", "id1", "id1", "id2", "id2", "id2", "id2","id2", "id2", "id2", "id2", "id2", "id2", "id2", "id2", "id3", "id3", "id3", "id3", "id3", "id3","id3", "id3", "id3", "id3", "id3", "id3", "id4", "id4", "id4","id4", "id4", "id4", "id4", "id4","id4", "id4", "id4", "id4", "id5", "id5", "id5", "id5", "id5","id5", "id5", "id5", "id5", "id5","id5", "id5", "id6", "id6", "id6", "id6", "id6", "id6", "id6","id6", "id6", "id6", "id6", "id6","id7", "id7", "id7", "id7", "id7", "id7", "id7", "id7", "id7","id7", "id7", "id7", "id8", "id8","id8", "id8", "id8", "id8", "id8", "id8", "id8", "id8", "id8","id8", "id9", "id9", "id9", "id9","id9", "id9", "id9", "id9", "id9", "id9", "id9", "id9", "id10","id10","id10", "id10", "id10","id10", "id10", "id10", "id10", "id10", "id10", "id10")
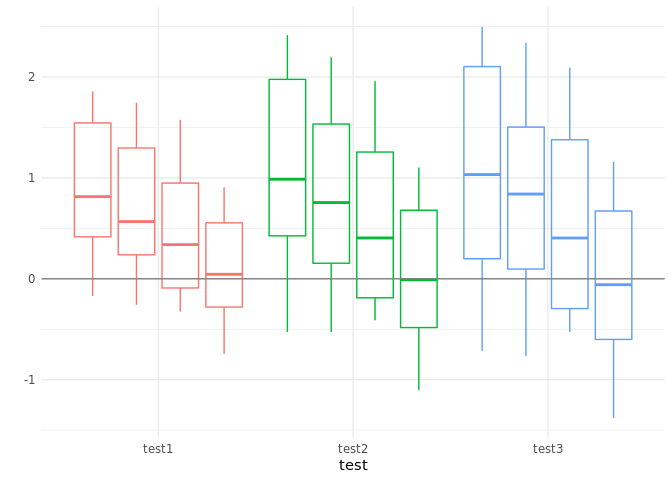
graph <- ggplot(data = example,mapping = aes_string(x="test",y="value",color="test",fill="group")) + geom_boxplot(alpha=0,position=position_dodge(.9)) + theme_minimal()
graph <- graph + theme(legend.position = "none",text=element_text(family="sans serif")) + geom_hline(yintercept = 0,color="gray50") + ylab("")
graph
graphplotly <- ggplotly(graph) %>% plotly::layout(boxmode = "group")
graphplotly
#> Warning: 'layout' objects don't have these attributes: 'boxmode'
#> Valid attributes include:
#> 'font', 'title', 'autosize', 'width', 'height', 'margin', 'paper_bgcolor', 'plot_bgcolor', 'separators', 'hidesources', 'showlegend', 'colorway', 'datarevision', 'uirevision', 'editrevision', 'selectionrevision', 'template', 'modebar', 'meta', 'transition', '_deprecated', 'clickmode', 'dragmode', 'hovermode', 'hoverdistance', 'spikedistance', 'hoverlabel', 'selectdirection', 'grid', 'calendar', 'xaxis', 'yaxis', 'ternary', 'scene', 'geo', 'mapbox', 'polar', 'radialaxis', 'angularaxis', 'direction', 'orientation', 'editType', 'legend', 'annotations', 'shapes', 'images', 'updatemenus', 'sliders', 'colorscale', 'coloraxis', 'metasrc', 'barmode', 'bargap', 'mapType'
Created on 2021-07-12 by the reprex package (v2.0.0)