library(ggplot2)
library(dplyr)
library(plotly)
# number of diamonds by cut and clarity (n)
cc <- count(diamonds, cut, clarity)
# number of diamonds by cut (nn)
cc2 <- left_join(cc, count(cc, cut, wt = n, name = 'nn')) %>%
mutate(prop = n / nn)
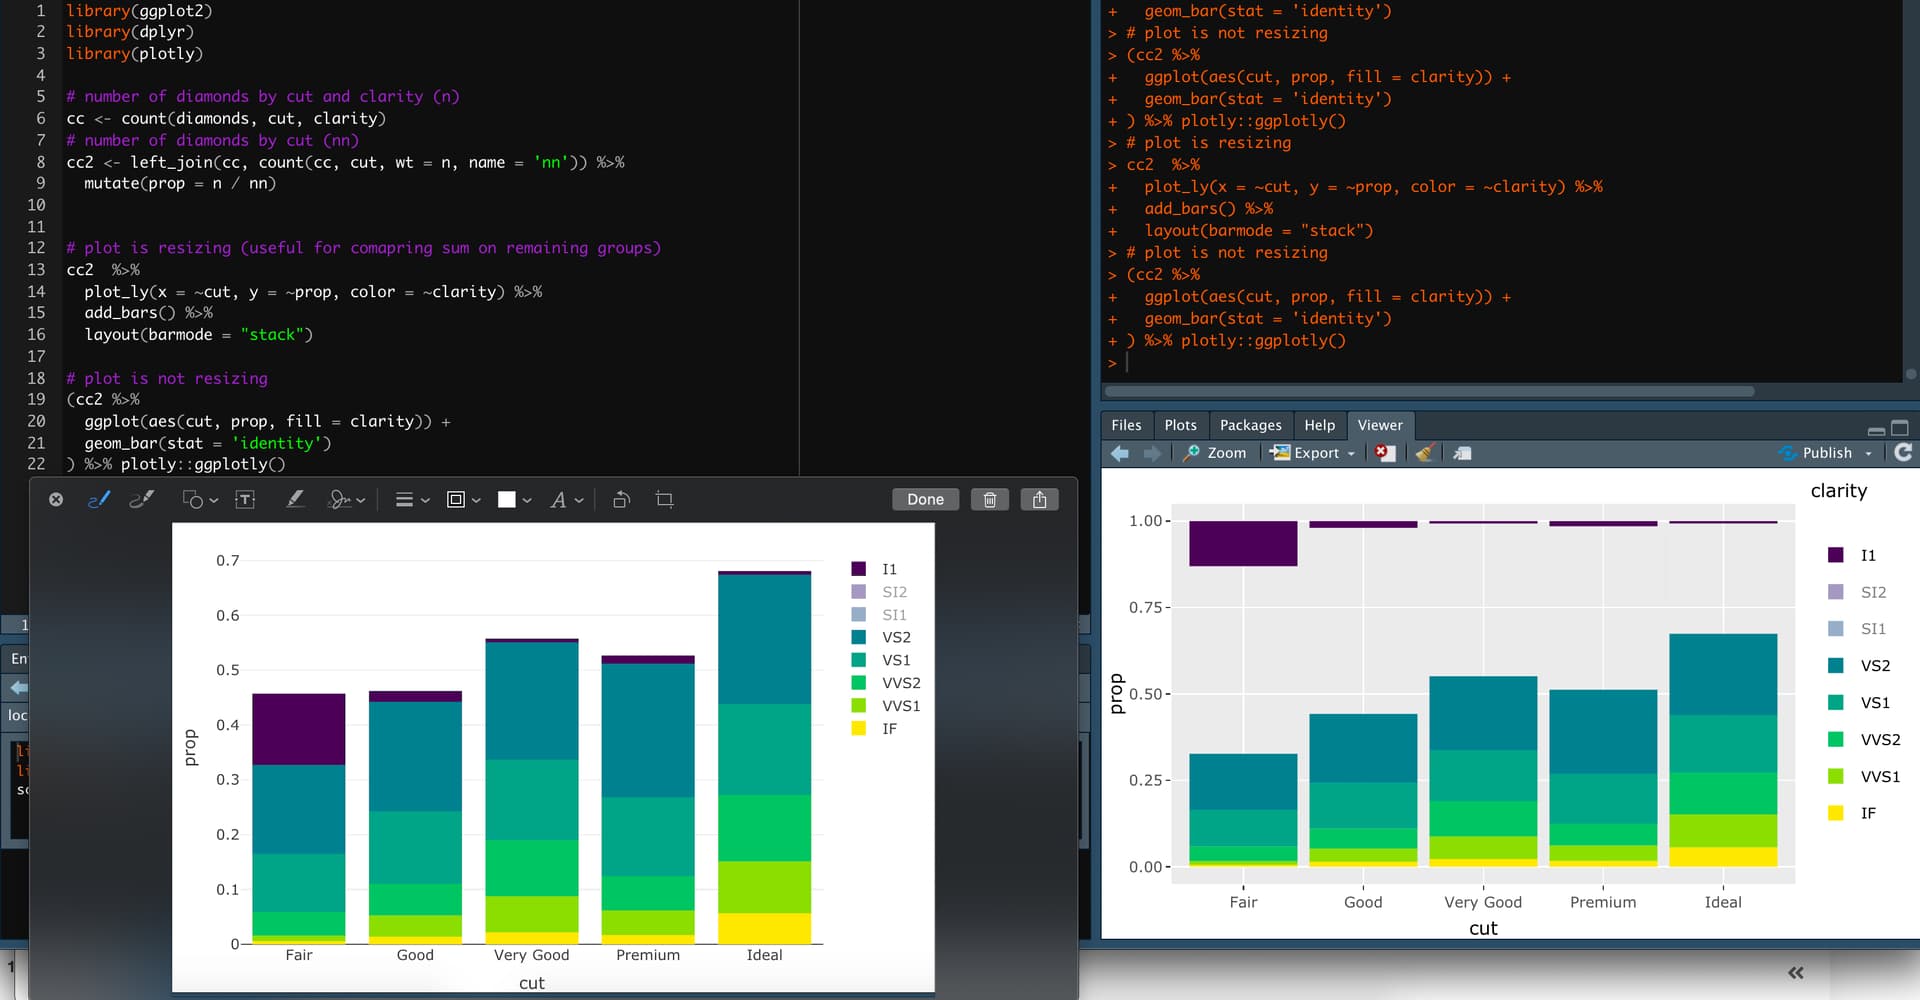
# plot is resizing (useful for comapring sum on remaining groups)
cc2 %>%
plot_ly(x = ~cut, y = ~prop, color = ~clarity) %>%
add_bars() %>%
layout(barmode = "stack")
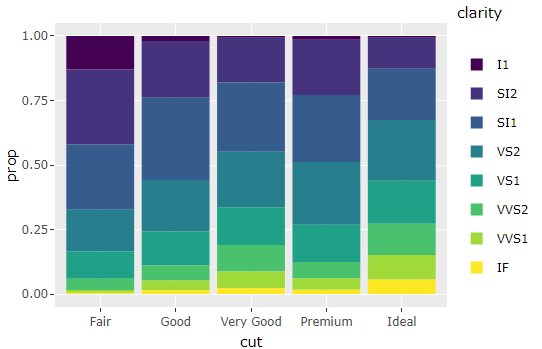
# plot is not resizing
(cc2 %>%
ggplot(aes(cut, prop, fill = clarity)) +
geom_bar(stat = 'identity')
) %>% plotly::ggplotly()
Does filtering (clicking SI1 and SI2 in the legend) provide a graph seen in the left? That is, I1 (dark purple) will stack on VS2 instead of keep "hanging" on the top of the graph (as seen on right graph)?
If so, what code produced it?