ggplot2/ usmapp maps with pattern fill, trying geom_polygon_pattern (updated post!)

Hey there,

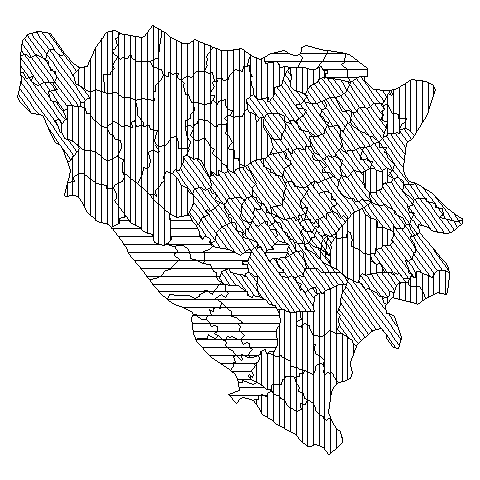
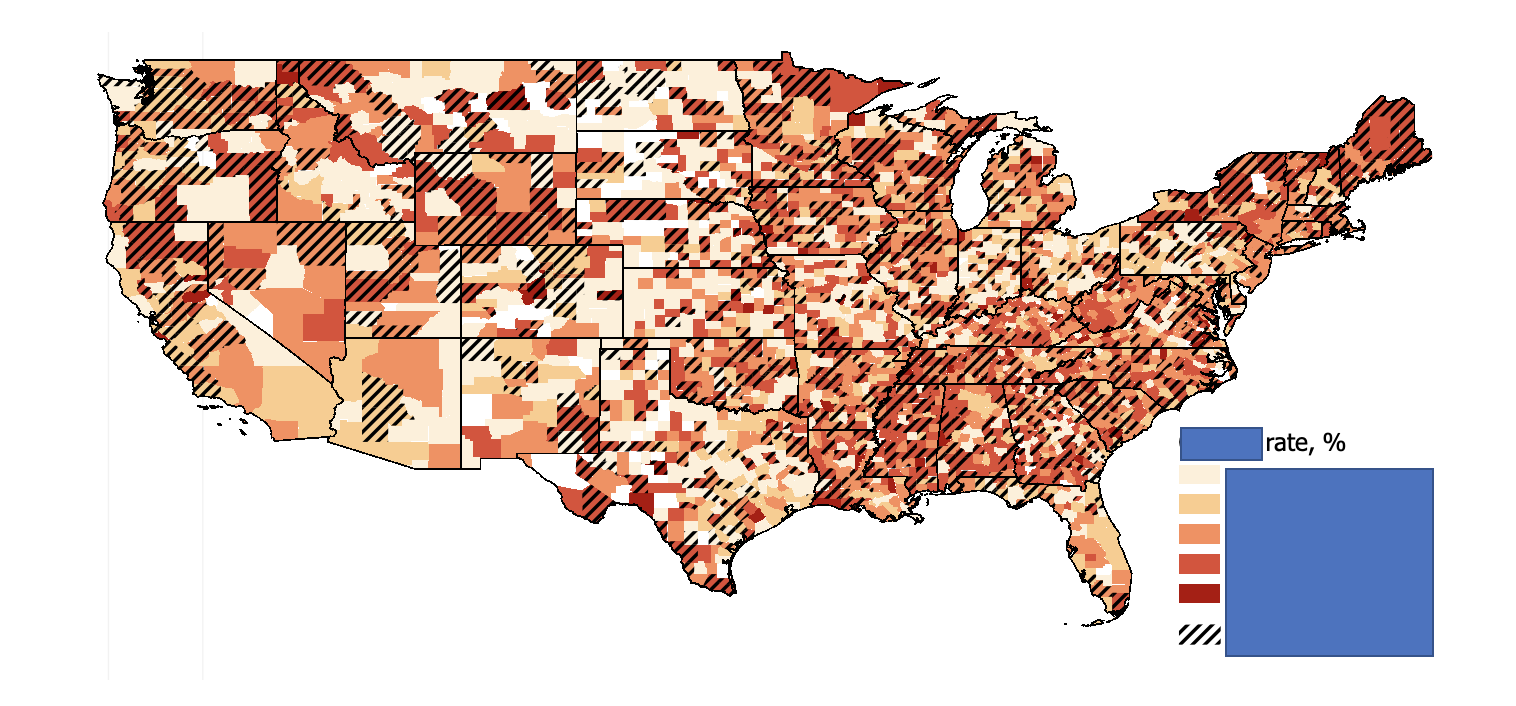
I am trying to create a map with two county-level variables and state-level boundaries, something like this:

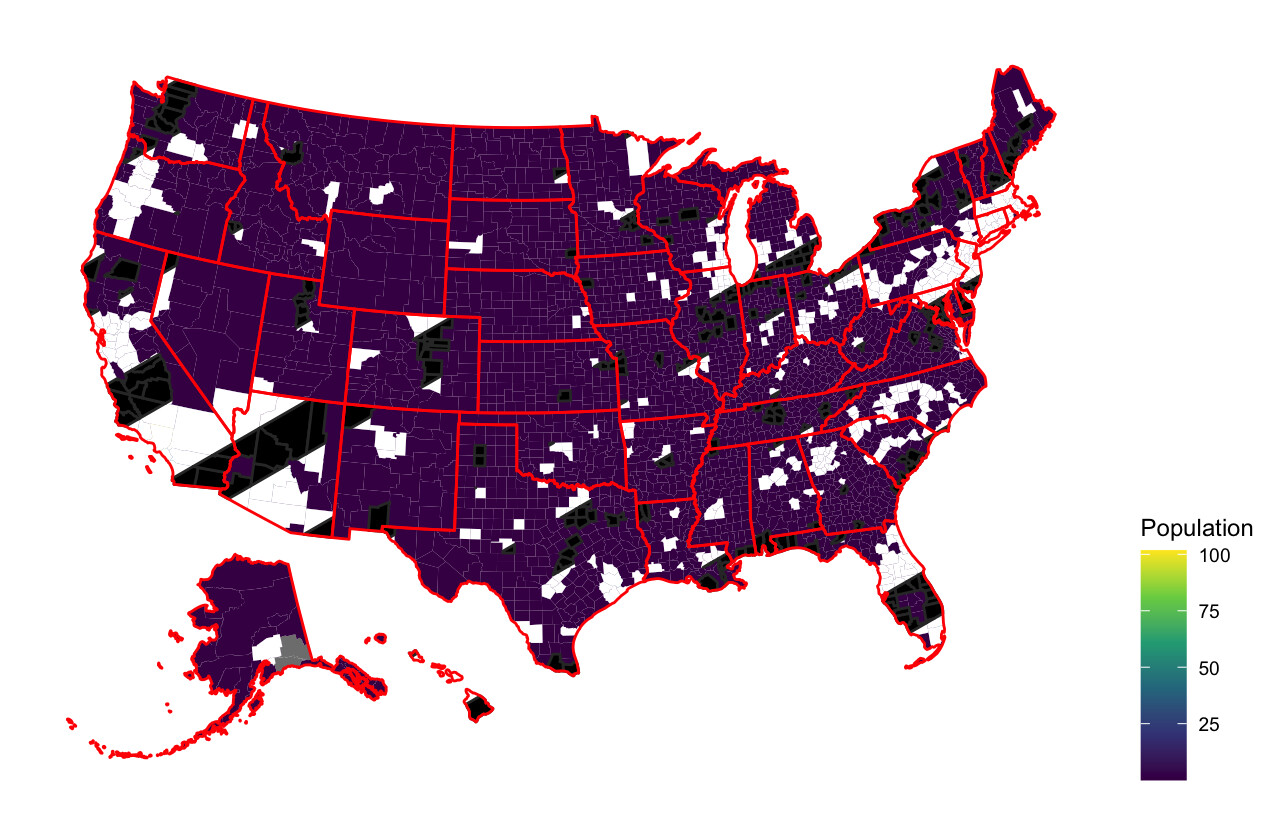
Here is an example of the code I am working on current code, it depicts county US population (continuous, purple/green gradient) and counties w/ + 1 million population (white and black stripes):

library("tidyverse")
library("usmap")

county_pop_info <- usmap::countypop  %>% 
  mutate(pop_2015_millions = pop_2015/100000,
         pop_2015_over_million = ifelse(pop_2015_millions > 1, ">= 1 million", "< 1 million")) 

#County population size 
usmap::plot_usmap(regions = "counties", 
                  data = county_pop_info, 
                  values = "pop_2015_millions",
                  linewidth = 0) + 
  scale_fill_continuous(type = "viridis", 
                        name = "Population") +
  theme(legend.position = "right") + 
  #Counties that are over 1 million
  geom_polygon_pattern(
    data = usmapdata::us_map(regions = "counties") %>%
      dplyr::right_join(county_pop_info, by = "fips") %>%
      dplyr::filter(pop_2015_over_million == ">= 1 million"),
    aes(x, y, group = group), 
    color = NA,
    linewidth = 0.2,
    fill            = 'white', 
    pattern_spacing = 0.15, 
    pattern_density = 0.4, 
    pattern_fill    = 'black') +
  #Plot state level borders: How to https://stackoverflow.com/questions/72543606/how-to-make-census-region-border-thicker-on-usmap-packake-r
  geom_polygon(data = usmapdata::us_map(regions = "states"),
               aes(x, y, group = group), fill = NA, linewidth = 0.5, color = "red")

My issue is that I want the stripes for counties with +1 million population to each be striped (versus stripes across all counties).

An earlier post serves as a great example of this issue, but I wasn't able able to do so with geom_map_pattern: ggplot2 pattern fill polygons by variable

See the FAQ: How to do a minimal reproducible example reprex for beginners. Code examples should permit reproducing the issue by simply cutting and pasting. The nzmap in the code provided produces the error

> nzmap
Error in `get_poly_lengths()`:
! There is a MULTIPOLYGON with length greater than 1

Thanks for your reply, I did not get the error you mentioned when I re-ran the code.

What do you get when you enter

nzmap

Hey there!

It looks like this:

 nz
        long       lat group order        region subregion
1   172.7433 -34.44215     1     1 North.Island       <NA>
2   172.7983 -34.45562     1     2 North.Island       <NA>
3   172.8528 -34.44846     1     3 North.Island       <NA>
4   172.8986 -34.41786     1     4 North.Island       <NA>
5   172.9593 -34.42503     1     5 North.Island       <NA>

nzmap

Odd. I’ll try on a couple of other setups. It would be helpful, though, to see this as a full representation, rather than just a snippet and an image. I suspect a missing package. reprex guarantees a fresh environment with only the code shown

Yeah, that was something odd with my Ubuntu installation. I'll check further. Do you have any objection to using {sf} so we can make polygons out of the region variable?

This is what I get from the code in my post:

Hey there! Updated my post w/ additional information and code!

No objection to using {sf}. What I am trying to do is combine two county-level maps w/ state-level indicators, so I was trying to keep using polygons (able add on to maps from usmaps)

I'm still confused. You're looking to do something like below in color? What variab le distinguishes counties?

image

This topic was automatically closed 42 days after the last reply. New replies are no longer allowed.

If you have a query related to it or one of the replies, start a new topic and refer back with a link.