I wanted to generate a random sample, plot it on a histogram, add a normal distribution to the background, but got the error message:
*Error in dnorm(mean = mu, sd = sigma) : *
argument "x" is missing, with no default*
Code was the following:
mu <- 5
sigma <- 1
n <- 10
ntraject <- 500
random_matrix <- rnorm(n * ntraject, mean = mu, sd = sigma) %>%
matrix(nrow = n, ncol = ntraject) %>%
tibble()
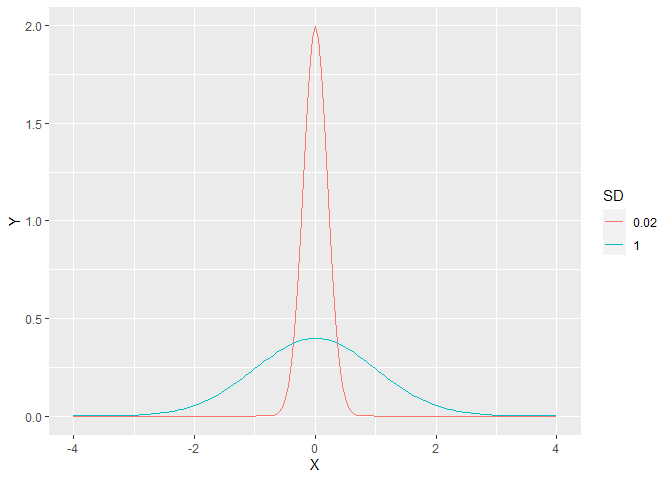
The y axis is the probability density, the probability per unit of the x axis. Here is a plot of the probability density of the normal distribution with a standard deviation of 1 and 0.2.
library(ggplot2)
Xvals <- seq(-4, 4, 0.05)
DF = data.frame(X = rep(Xvals,2),
                Y = c(dnorm(Xvals, mean = 0, sd = 1), dnorm(Xvals, mean = 0, sd = 0.2)),
                SD = rep(c("1", "0.02"), each = 161))
ggplot(DF, aes(X, Y, color = SD)) + geom_line()
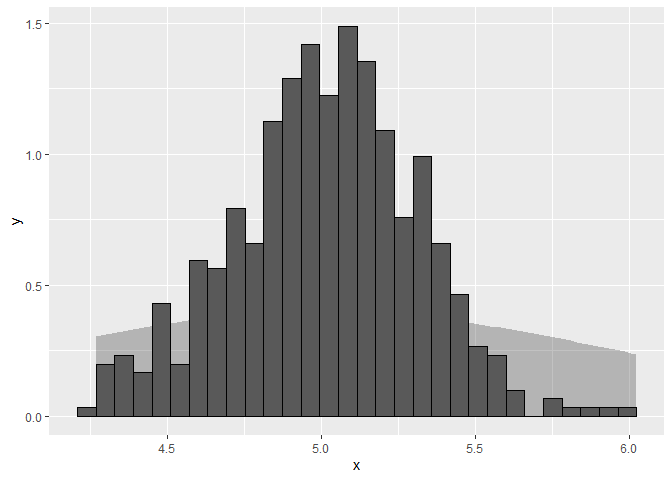
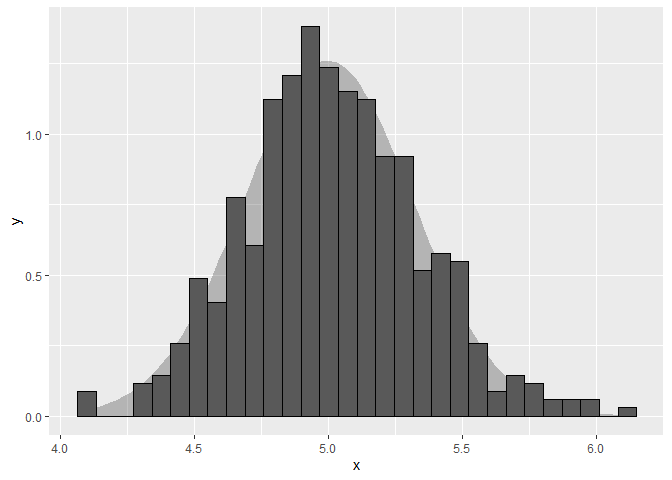
That isn't the proportion, it is scaled so the area of the bars sum to 1. If a bar's wdith is narrow (less than 1), the height can be greater than 1. I was replying at the same time as FJCC and you may want to note you need to divide by sqrt(n) to get the correct distribution to match up:
library(ggplot2)
library(tibble)
mu <- 5
sigma <- 1
n <- 10
ntraject <- 500

random_matrix <- rnorm(n * ntraject, mean = mu, sd = sigma) %>%
  matrix(nrow = n, ncol = ntraject) %>%
  tibble()

ggplot(data = data.frame(x=colMeans(random_matrix)),aes(x=x)) +
  stat_function(fun=dnorm, args = list(mean = mu, sd = sigma/sqrt(n)), geom = "area", alpha = .3) +
  geom_histogram(aes(y = ..density..), color = "black")
#> `stat_bin()` using `bins = 30`. Pick better value with `binwidth`.