Hi,
My data looks like:
school gender n
1 1 200
1 2 230
2 1 60
2 2 215
...
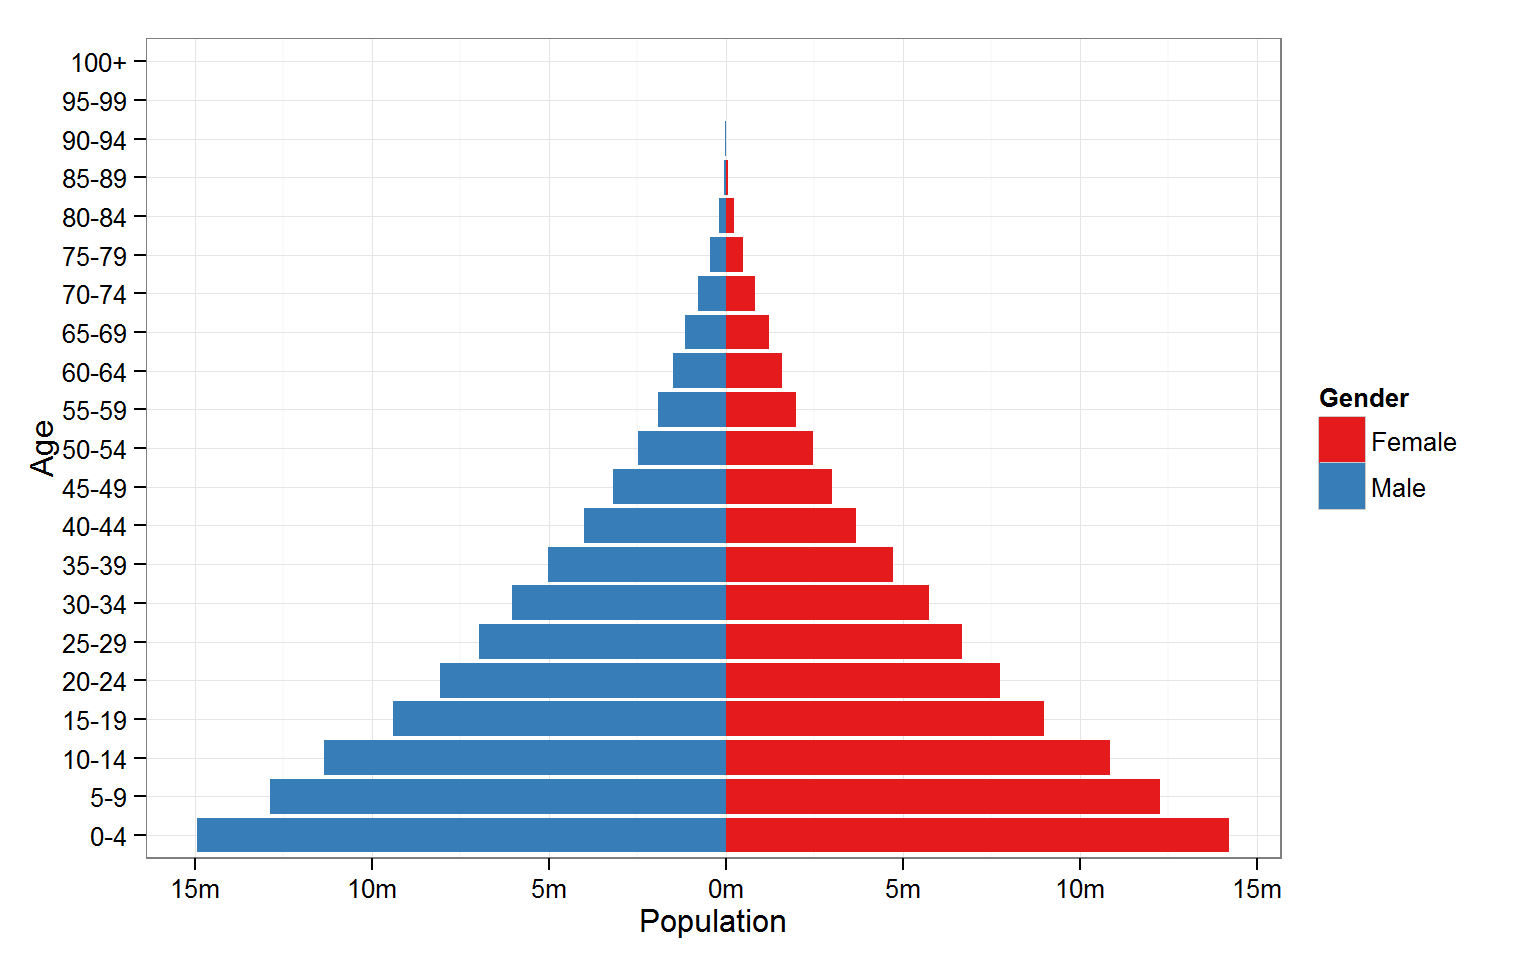
I want to build a stacked pyramid with school at Y axis and n in X axis.
Each step of pyramid should show which part of students is female and which male
Please help