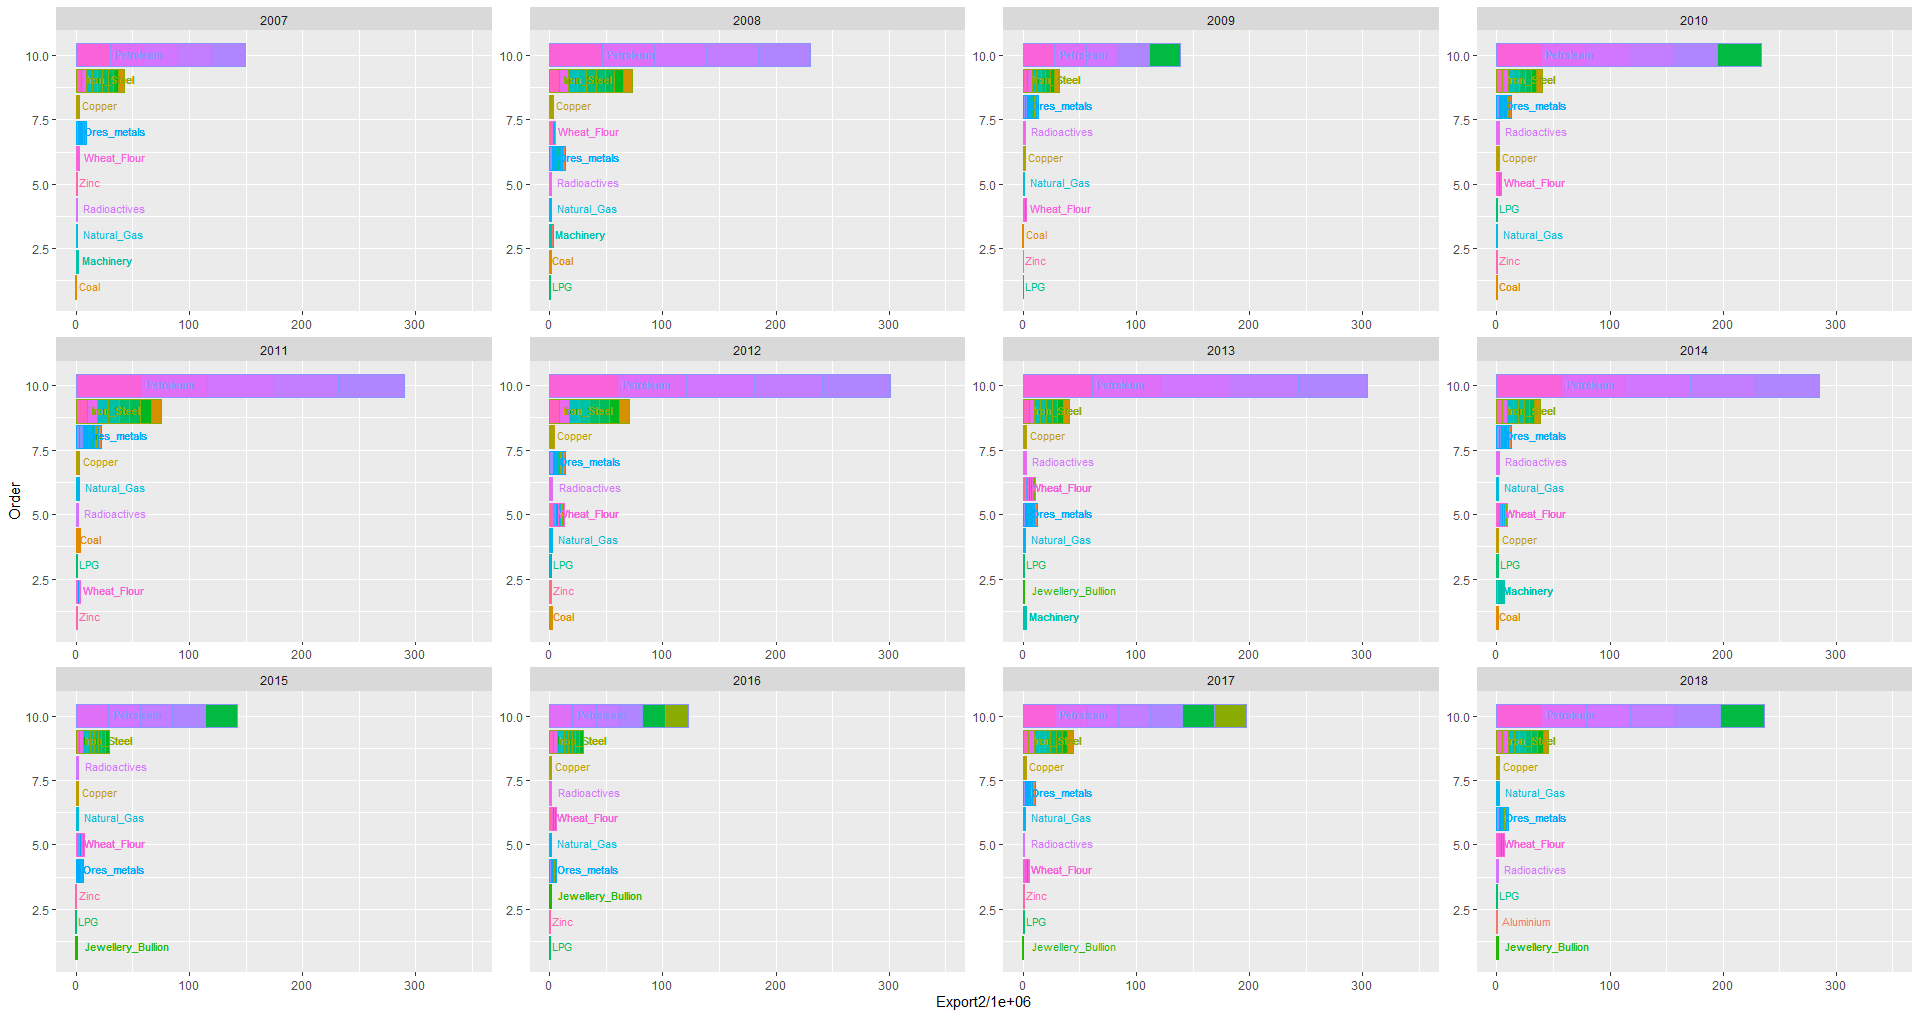
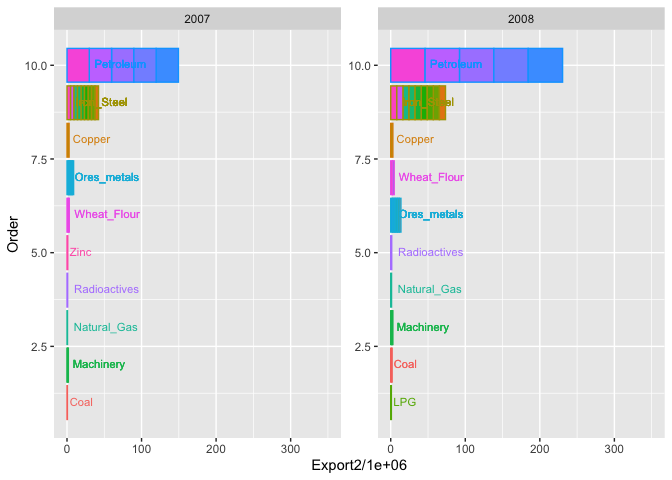
I have dataframe for 10 years, out of which I am submitting 2 years data for a reproducible example.
There is a stacking and scaling problem with the bars.
structure(list(YEAR = c(2007L, 2007L, 2007L, 2007L, 2007L, 2007L,
2007L, 2007L, 2007L, 2007L, 2007L, 2007L, 2007L, 2007L, 2007L,
2007L, 2007L, 2007L, 2007L, 2007L, 2007L, 2007L, 2007L, 2007L,
2007L, 2007L, 2007L, 2007L, 2007L, 2008L, 2008L, 2008L, 2008L,
2008L, 2008L, 2008L, 2008L, 2008L, 2008L, 2008L, 2008L, 2008L,
2008L, 2008L, 2008L, 2008L, 2008L, 2008L, 2008L, 2008L, 2008L,
2008L, 2008L, 2008L, 2008L, 2008L, 2008L, 2008L, 2008L, 2008L
), Product = c("Petroleum oils or bituminous minerals > 70 % oil",
"Petroleum oils, oils from bitumin. materials, crude", "Other crude minerals",
"Residual petroleum products, n.e.s., related mater.", "Petroleum gases, other gaseous hydrocarbons, n.e.s.",
"Ball or roller bearings", "Pig iron & spiegeleisen, sponge iron, powder & granu",
"Flat-rolled prod., iron, non-alloy steel, coated, clad", "Flat-rolled products of alloy steel",
"Iron ore and concentrates", "Ferrous waste, scrape; remelting ingots, iron, steel",
"Sulphur and unroasted iron pyrites", "Flat-rolled prod., iron, non-alloy steel, not coated",
"Ingots, primary forms, of iron or steel; semi-finis.", "Copper",
"Ores and concentrates of base metals, n.e.s.", "Copper ores and concentrates; copper mattes, cemen",
"Manufactures of base metal, n.e.s.", "Aluminium ores and concentrates (incl. alumina)",
"Gold, non-monetary (excluding gold ores and concentrates)",
"Meal and flour of wheat and flour of meslin", "Wheat (including spelt) and meslin, unmilled",
"Zinc", "Radio-actives and associated materials", "Natural gas, whether or not liquefied",
"Electrical machinery & apparatus, n.e.s.", "Aircraft & associated equipment; spacecraft, etc.",
"Tubes, pipes & hollow profiles, fittings, iron, steel", "Coal, whether or not pulverized, not agglomerated",
"Residual petroleum products, n.e.s., related mater.", "Petroleum oils or bituminous minerals > 70 % oil",
"Petroleum gases, other gaseous hydrocarbons, n.e.s.", "Petroleum oils, oils from bitumin. materials, crude",
"Other crude minerals", "Iron ore and concentrates", "Ferrous waste, scrape; remelting ingots, iron, steel",
"Sulphur and unroasted iron pyrites", "Pig iron & spiegeleisen, sponge iron, powder & granu",
"Flat-rolled prod., iron, non-alloy steel, not coated", "Ingots, primary forms, of iron or steel; semi-finis.",
"Ball or roller bearings", "Flat-rolled prod., iron, non-alloy steel, coated, clad",
"Flat-rolled products of alloy steel", "Copper", "Meal and flour of wheat and flour of meslin",
"Wheat (including spelt) and meslin, unmilled", "Gold, non-monetary (excluding gold ores and concentrates)",
"Copper ores and concentrates; copper mattes, cemen", "Manufactures of base metal, n.e.s.",
"Non-ferrous base metal waste and scrap, n.e.s.", "Aluminium ores and concentrates (incl. alumina)",
"Ores and concentrates of base metals, n.e.s.", "Radio-actives and associated materials",
"Natural gas, whether or not liquefied", "Electrical machinery & apparatus, n.e.s.",
"Tubes, pipes & hollow profiles, fittings, iron, steel", "Aircraft & associated equipment; spacecraft, etc.",
"Coke & semi-cokes of coal, lign., peat; retort carbon", "Coal, whether or not pulverized, not agglomerated",
"Liquefied propane and butane"), Export = c(1372686.455, 28125875.547,
81225.326, 279972.276, 33444.216, 96351.945, 1420761.85, 577914.585,
39790.575, 795650.888, 338749.019, 69763.087, 1030047.529, 327587.704,
2774753.829, 531876.982, 260366.854, 56920.456, 522493.466, 398898.941,
339222.406, 1170506.955, 1009023.697, 861280.967, 654776.104,
52598.13, 457163.028, 87312.682, 521783.504, 454573.286, 2002937.83,
50796.22, 43507922.969, 89414.102, 1279154.553, 585401.581, 513796.315,
2964476.143, 1327554.009, 630899.019, 115137.85, 695107.821,
50662.589, 2865999.942, 848429.826, 1458779.922, 554942.736,
357477.454, 72236.755, 47963.24, 493559.983, 754220.01, 1306960.584,
1083496.265, 52958.24, 192728.295, 703945.229, 68421.85, 842247.145,
844174.512), Product2 = c("Petroleum", "Petroleum", "Petroleum",
"Petroleum", "Petroleum", "Iron_Steel", "Iron_Steel", "Iron_Steel",
"Iron_Steel", "Iron_Steel", "Iron_Steel", "Iron_Steel", "Iron_Steel",
"Iron_Steel", "Copper", "Ores_metals", "Ores_metals", "Ores_metals",
"Ores_metals", "Ores_metals", "Wheat_Flour", "Wheat_Flour", "Zinc",
"Radioactives", "Natural_Gas", "Machinery", "Machinery", "Machinery",
"Coal", "Petroleum", "Petroleum", "Petroleum", "Petroleum", "Petroleum",
"Iron_Steel", "Iron_Steel", "Iron_Steel", "Iron_Steel", "Iron_Steel",
"Iron_Steel", "Iron_Steel", "Iron_Steel", "Iron_Steel", "Copper",
"Wheat_Flour", "Wheat_Flour", "Ores_metals", "Ores_metals", "Ores_metals",
"Ores_metals", "Ores_metals", "Ores_metals", "Radioactives",
"Natural_Gas", "Machinery", "Machinery", "Machinery", "Coal",
"Coal", "LPG"), Export2 = c(29893203.82, 29893203.82, 29893203.82,
29893203.82, 29893203.82, 4696617.182, 4696617.182, 4696617.182,
4696617.182, 4696617.182, 4696617.182, 4696617.182, 4696617.182,
4696617.182, 2774753.829, 1770556.699, 1770556.699, 1770556.699,
1770556.699, 1770556.699, 1509729.361, 1509729.361, 1009023.697,
861280.967, 654776.104, 597073.84, 597073.84, 597073.84, 521783.504,
46105644.407, 46105644.407, 46105644.407, 46105644.407, 46105644.407,
8162189.88, 8162189.88, 8162189.88, 8162189.88, 8162189.88, 8162189.88,
8162189.88, 8162189.88, 8162189.88, 2865999.942, 2307209.748,
2307209.748, 2280400.178, 2280400.178, 2280400.178, 2280400.178,
2280400.178, 2280400.178, 1306960.584, 1083496.265, 949631.764,
949631.764, 949631.764, 910668.995, 910668.995, 844174.512),
Order = c(10L, 10L, 10L, 10L, 10L, 9L, 9L, 9L, 9L, 9L, 9L,
9L, 9L, 9L, 8L, 7L, 7L, 7L, 7L, 7L, 6L, 6L, 5L, 4L, 3L, 2L,
2L, 2L, 1L, 10L, 10L, 10L, 10L, 10L, 9L, 9L, 9L, 9L, 9L,
9L, 9L, 9L, 9L, 8L, 7L, 7L, 6L, 6L, 6L, 6L, 6L, 6L, 5L, 4L,
3L, 3L, 3L, 2L, 2L, 1L)), row.names = c(NA, -60L), class = c("grouped_df",
"tbl_df", "tbl", "data.frame"), groups = structure(list(YEAR = c(2007L,
2007L, 2007L, 2007L, 2007L, 2007L, 2007L, 2007L, 2007L, 2007L,
2008L, 2008L, 2008L, 2008L, 2008L, 2008L, 2008L, 2008L, 2008L,
2008L), Product2 = c("Coal", "Copper", "Iron_Steel", "Machinery",
"Natural_Gas", "Ores_metals", "Petroleum", "Radioactives", "Wheat_Flour",
"Zinc", "Coal", "Copper", "Iron_Steel", "LPG", "Machinery", "Natural_Gas",
"Ores_metals", "Petroleum", "Radioactives", "Wheat_Flour"), .rows = list(
29L, 15L, 6:14, 26:28, 25L, 16:20, 1:5, 24L, 21:22, 23L,
58:59, 44L, 35:43, 60L, 55:57, 54L, 47:52, 30:34, 53L, 45:46)), row.names = c(NA,
-20L), class = c("tbl_df", "tbl", "data.frame"), .drop = TRUE))
I have created a plot, but is not neat and there a stacking and scaling problem in the bars. So far the code deployed is as follows,
library(ggplot2)
library(scales)
ggplot(kazex6, aes(x = Order, y = Export2/1000000, fill = Product, colour = Product2)) +
geom_bar(stat = "identity") + coord_flip() +
facet_wrap(~YEAR, scales = "free", drop = T) +
theme(legend.position = "none") +
geom_text(aes(label=Product2), angle = 0,
vjust=.3, hjust = -.1, size=3) +
scale_y_continuous(limits = c(0, 350))
It is not a great plot. As, the picture shows.