I'm new to R and started with basic plots. I have used a simple excel table which has the following columns- Family, Family Name, Product.ID, Sales, Time, Value
The data table is similar to the below
|Family|Family.Name|Product.ID|Sales|Time|Value|
|19A| A Box|AA980|ACTUALSALESUNITS|Jan 2021|63|
|19A| A Box|AA980|ACTUALSALESUNITS|Feb 2021|34|
|19A| A Box|AA980|ACTUALSALESUNITS|Mar 2021|93|
|19A| A Box|AA980|ACTUALSALESUNITS|Apr 2021|99|
|19B| B Box|AL345|ACTUALSALESUNITS|Jan 2021|1|
|19B| B Box|AL345|ACTUALSALESUNITS|Feb 2021|0|
|19B| B Box|AL345|ACTUALSALESUNITS|Mar 2021|0|
|19B| B Box|AL345|ACTUALSALESUNITS|Apr 2021|0|
I used the code below but for some reason the when I try to group the chart by Family Name it is just showing a single color and even the legends is not appearing for all values in Family Name
library(tidyverse)
#economics is a builtin dataset
(head(economics))
# imagine it has column names with spaces we want to use
economics$`Unemployment Values` <- economics$unemploy
(head(economics))

#original works
ggplot(economics, aes(date, unemploy)) + geom_line()

#incorrect quotes, dont work, as they force a single static 'value'
ggplot(economics, aes(date, "Unemployment Values")) + geom_line()

# correct quoting for non standard variable name is backticks like this
ggplot(economics, aes(date, `Unemployment Values`)) + geom_line()
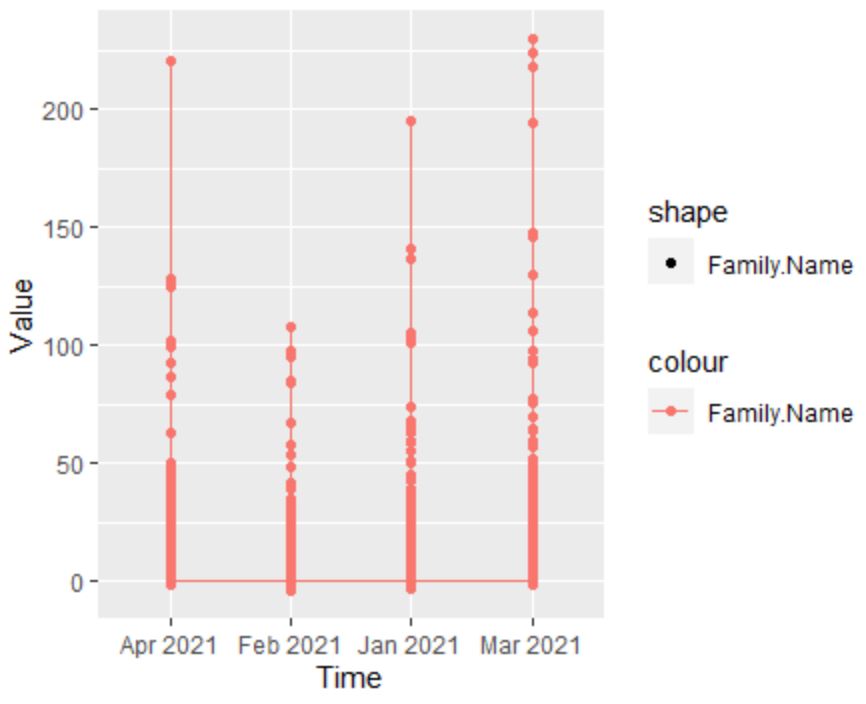
Thank you so much. Using Backticks work while dealing with fields which has spaces in it. But Still all of the field values are not appearing on the chart.
Since the data contain thirteen values in the family name column and when I try to plot by grouping the family name column. It shows only 6 family name values and didnt include the remaining as it shows the below error
1: The shape palette can deal with a maximum of 6 discrete values because more
than 6 becomes difficult to discriminate; you have 13. Consider specifying
shapes manually if you must have them.
2: Removed 1512 rows containing missing values (geom_point).
So I believe I have to limit the number of values which I try to group, but it would be better if I'd be able to group by all the thirteen values
can you write a list of the 13 shapes you want to use to represent each family name ?
Here is a list to choose from
circle
circle open
circle filled
circle cross
circle plus
circle small
bullet
square
square open
square filled
square cross
square plus
square triangle
diamond
diamond open
diamond filled
diamond plus
triangle
triangle open
triangle filled
triangle square
triangle down open
triangle down filled
plus
cross
asterisk
Thanks a lot. It does work now :). One question though.. is it possible to assign a specific shape to a specific family value?. For example- A BOX- asterisk shape