I have a data set where two levels of a variable differ on the x-axis over the range of the y variable, and I'd like to plot a smooth of x~y rather than the usual smooth of y~x. I know that I can reverse the two axes, and that gives a very nice plot. But in the domain of these data, it is traditional to plot x horizontally and y vertically. Is there a way to tell ggplot to do a x~y smooth rather than a y~x smooth? Thanks for any help on this.
Larry Hunsicker
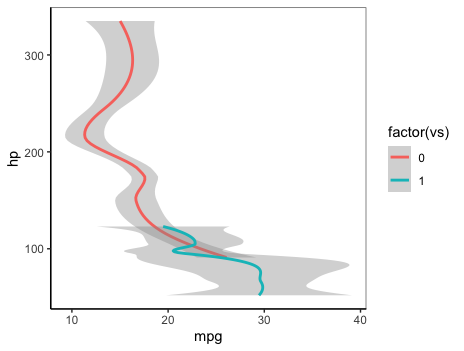
Does + coord_flip() do what you need, or am I misunderstanding your question? For example, say we want the regression model mpg ~ hp, but we want mpg on the x-axis and hp on the y-axis. We could do:
ggplot(mtcars, aes(hp, mpg, colour=factor(vs))) +
  geom_smooth() +
  coord_flip()
That's it exactly! There seems to be a simple command for everything, but it's often not obvious.
Many thanks, Joel.
This topic was automatically closed 7 days after the last reply. New replies are no longer allowed.