My wish: fill the circles with the color from scale_fill or scale_color so that I only have one single legend instead of two. Would it be possible? Thank you!
library(ggplot2)

p <- ggplot(mtcars, aes(wt, mpg))
Circles with only one color (what is wrong at the edges of the circles by the way?)
Hi @RuReady! Normally, guides (a catch-all term for legends, colour bars and other visual demonstrations of scale on the plot) combine automatically, and you can nudge things along by explicitly giving their associated scales the same name.
But in this case the legends are different types by default: the fill guide is a "colourbar", and the size guide is a "legend" (NB: a legend in ggplot2 is a type of guide that shows the scale at a few discrete levels). You'll have to get them to agree on a guide type in order to combine them.
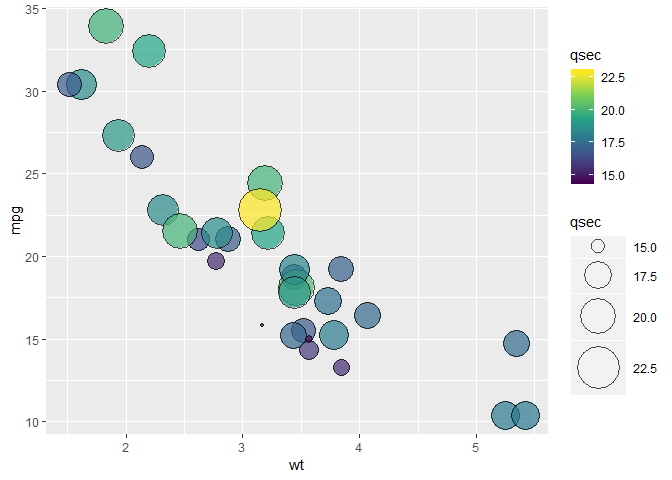
Since it doesn't really make sense to have a continuous guide like a colour bar for size, you'll probably have to go the other way and force the fill scale to use a legend:
library(ggplot2)
#> Warning: package 'ggplot2' was built under R version 3.5.1

p <- ggplot(mtcars, aes(wt, mpg))

p + geom_point(aes(size = qsec, fill = qsec), shape = 21, alpha = 0.7) +
  scale_fill_viridis_c(guide = "legend") +
  scale_size_continuous(range = c(1, 15))
No worries! I've only just moved back to Windows after a few years on a Mac, but I've definitely noticed that rendering on Windows is a little blockier at times. Maybe it's to do with that? Hopefully someone else can shed some light on this
There was some discussion of Windows screen graphics before, but I’m not sure if it got anywhere (seems like confusion between on-screen display quality and saved-to-a-file output quality tends to creep in):


 I've only just moved back to Windows after a few years on a Mac, but I've definitely noticed that rendering on Windows is a little blockier at times. Maybe it's to do with that? Hopefully someone else can shed some light on this