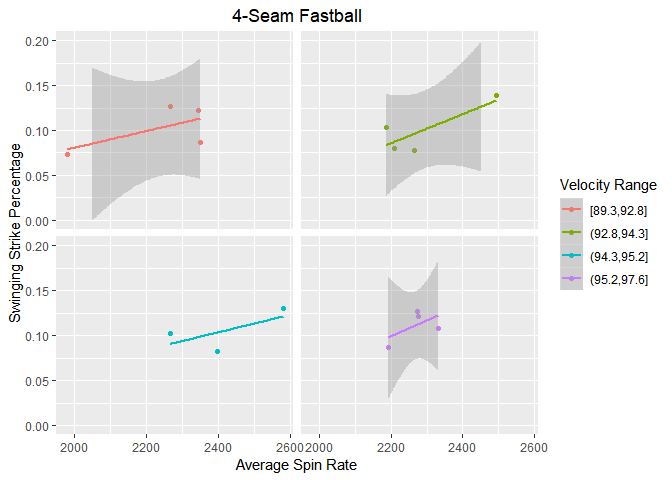
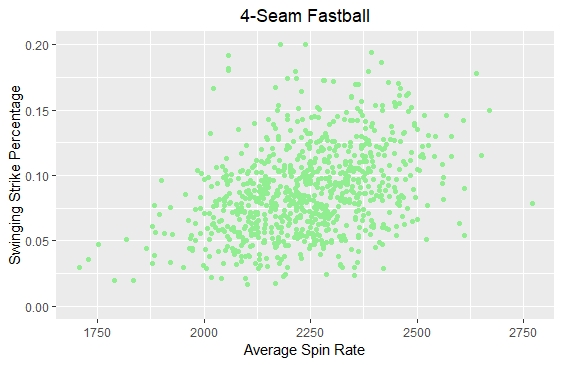
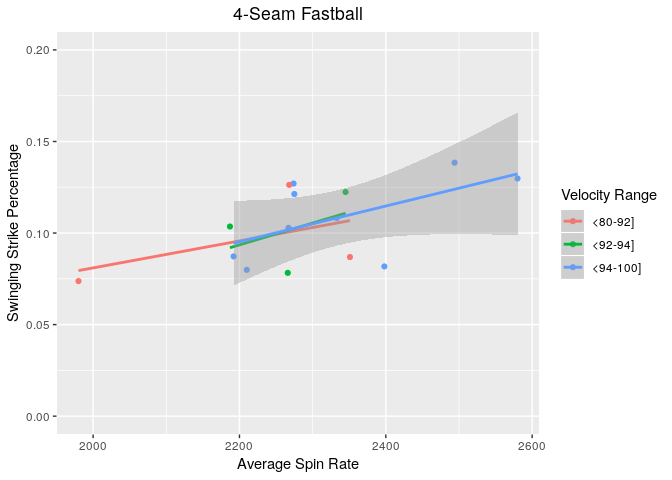
Are you looking for facets?
library(ggplot2)
#> Registered S3 methods overwritten by 'ggplot2':
#>   method         from
#>   [.quosures     rlang
#>   c.quosures     rlang
#>   print.quosures rlang

fourseamers1 <- data.frame(spin_rate = c(2580, 2210, 2275, 2333, 2494, 2274, 2187, 2351, 2268, 2345, 1980, 2266, 2192, 2398, 2267),
                           velocity = c(95.1, 94.3, 96.2, 97.6, 94.2, 95.4, 93.3, 89.3, 91.3, 92.4, 91.1, 93.2, 95.2, 95.1, 94.6),
                           swstrike = c(0.129782082324455, 0.0798982188295165, 0.121307353865493, 0.108133669609079, 0.138432364096081, 0.127034790935206, 0.103564223268325, 0.0868979454361738, 0.126290433585685, 0.122392211404729, 0.0737647877522617, 0.0782516743038421, 0.0872363246335359, 0.0817587209302326, 0.10285505124451),
                           player_name = c("Justin Verlander", "Kevin Gausman", "Gerrit Cole", "Luis Severino", "Max Scherzer", "James Paxton", "Sean Newcomb", "Marco Estrada", "Jake Odorizzi", "J.A. Happ", "Sean Manaea", "Mike Clevinger", "German Marquez", "Blake Snell", "Nick Pivetta"))

ggplot(data = within(data = fourseamers1,
                     expr = {velocity_range <- cut(x = velocity,
                                                   breaks = quantile(x = velocity),
                                                   include.lowest = TRUE)}),
       mapping = aes(x = spin_rate,
                     y = swstrike,
                     colour = velocity_range)) +
  geom_point() +
  geom_smooth(method = "lm") +
  scale_y_continuous(limits = c(0, 0.2)) +
  labs(title = "4-Seam Fastball",
       x = "Average Spin Rate",
       y = "Swinging Strike Percentage",
       colour = "Velocity Range") +
  theme(plot.title = element_text(hjust = 0.5),
        strip.text = element_blank()) +
  facet_wrap(facets = ~ velocity_range,
             nrow = 2)


