You need to use the group parameter in the aesthetic to tell geom_line which points belong together. Also, a line's color is controlled with color not with fill.
library(ggplot2)
library(tibble)
library(tidyr)
df2<-data.frame(c(1000,700),c(2000,1500))
rownames(df2)<-c("Revenue", "EBITDA")
colnames(df2)<-c("2020", "2021")
# reshape dataset
df2_upd = df2 %>% rownames_to_column("Financials") %>% gather(year, value, -Financials)
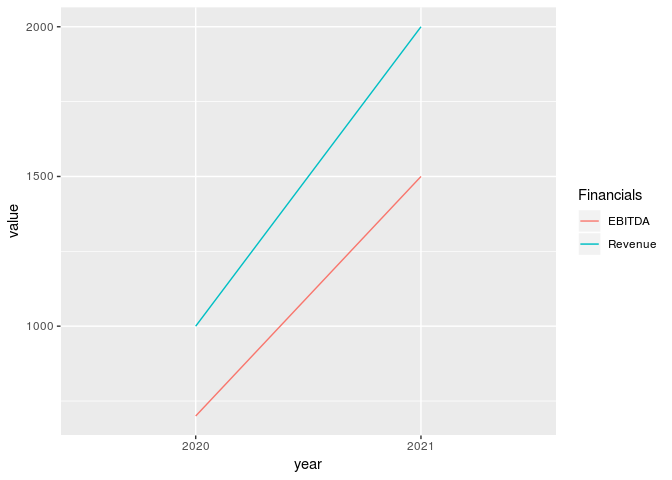
print(df2_upd)
#> Financials year value
#> 1 Revenue 2020 1000
#> 2 EBITDA 2020 700
#> 3 Revenue 2021 2000
#> 4 EBITDA 2021 1500
# plot using the new dataset
ggplot(data=df2_upd, aes(x=year, y=value, color=Financials, group = Financials)) + geom_line()