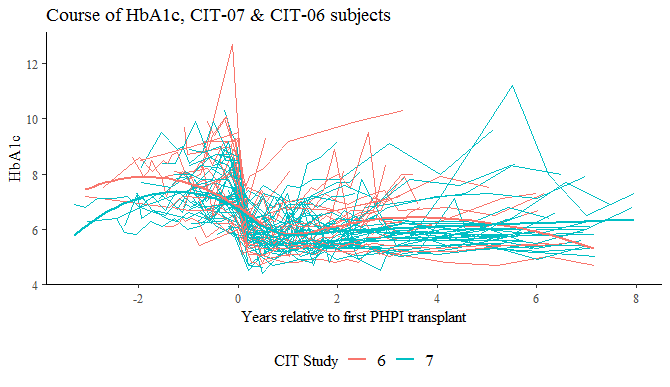
I have a "spaghetti plot" showing individual courses of HbA1c for two different groups of subjects, together with a separate smooth for each group of subjects. I would like to have the luminosity for the individual subjects much lighter and the smooths darker so that the two smooths are easier to see. I have tried several things but I haven't been able to work out the magic. I tried setting 'scale_colour_hue(l=80)' for the individual lines, but that didn't seem to do anything. My code is below, and my current figure, with the individual lines and the two smooths with the same intensity. I suppose that I could also specify new colors for the smooths, but again, I haven't succeeded.
Any help will be deeply appreciated.
Larry Hunsicker
ggplot(hba1c[hba1c$StudyID >5,],
  aes(NumDaysInitial/365.25,HbA1c,group=PatientID,
  color=as.factor(StudyID))) +
  geom_line() +
  scale_colour_hue(l=80) +
  geom_smooth(aes(group = as.factor(StudyID)), se = F) +
  theme(legend.position = "bottom") +
  scale_color_discrete(name ="CIT Study") +
  scale_x_continuous(breaks=seq(-4,8,2)) +
  labs(x = "Years relative to first PHPI transplant",
         title = "Course of HbA1c, CIT-07 & CIT-06 subjects")
I tried playing with the hue and it did have an effect, especially when I made it much less than 80, but it did not help with seeing the geom_smooth() lines. What do you think of adjusting the transparency with alpha?
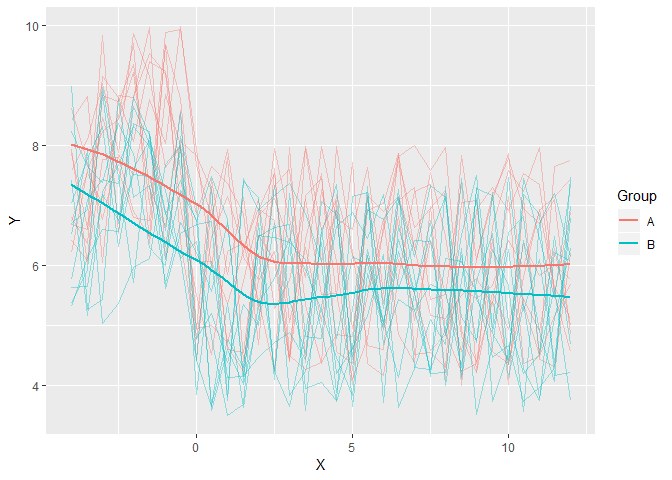
library(ggplot2)
x <- seq(-4, 12, 0.5)
ybase1 = c(rep(8, 8), rep(6, 25))
ybase2 = c(rep(7, 8), rep(5.5, 25))
set.seed(25234)
DF <- data.frame(X = rep(x, 20), Y = c(rep(ybase1, 10) + runif(330, -2, 2),
                                       rep(ybase2, 10) + runif(330, -2, 2)),
                 Group = rep(c("A","B"), each = 330),
                 subgroup = (rep(1:20, each = 33)))
ggplot(DF, aes(X, Y, group = subgroup, color = Group)) + geom_line(alpha = 0.4) +
  geom_smooth(aes(group = Group), se = FALSE)
#> `geom_smooth()` using method = 'loess' and formula 'y ~ x'
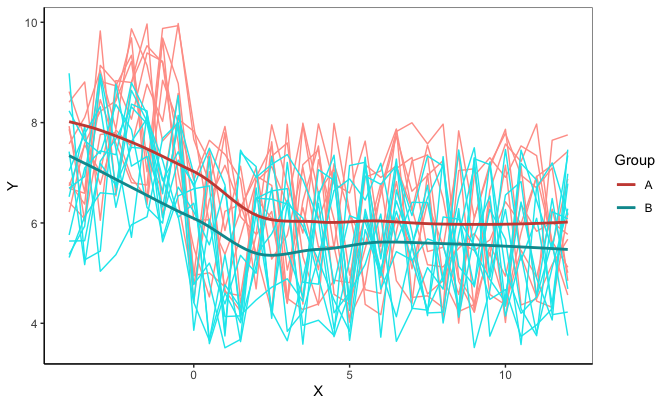
You could try the ggnewscale package, which allows you to set more than one scale for a given aesthetic. In this case, we'll set two different color scales. In the code below, note that we set the colors of the individual lines to have a luminance of 80 and the colors of the smooths to have a luminance of 50 (of course you can play around with the settings to get the exact colors you desire). For illustration, I've used the data frame created by FJCC:
#devtools::install_github("eliocamp/ggnewscale")
library(ggplot2)
library(ggnewscale)

x <- seq(-4, 12, 0.5)
ybase1 = c(rep(8, 8), rep(6, 25))
ybase2 = c(rep(7, 8), rep(5.5, 25))
set.seed(25234)
DF <- data.frame(X = rep(x, 20), Y = c(rep(ybase1, 10) + runif(330, -2, 2),
                                       rep(ybase2, 10) + runif(330, -2, 2)),
                 Group = rep(c("A","B"), each = 330),
                 subgroup = (rep(1:20, each = 33)))

ggplot(DF, aes(X, Y, group = subgroup, color = Group)) +
  geom_line() +
  scale_color_manual(values=hcl(c(15,195), 100, 80)) +
  new_scale_colour() +
  geom_smooth(aes(group = Group, colour=Group), se = FALSE) +
  scale_color_manual(values=hcl(c(15,195), 100, 50))
Thanks. I didn't know about alpha. This works very well.
Are you a violist? Or is it related to the CC in your name? One doesn't see the C-clef too often.
Larry