ggplot x axis dates out of order

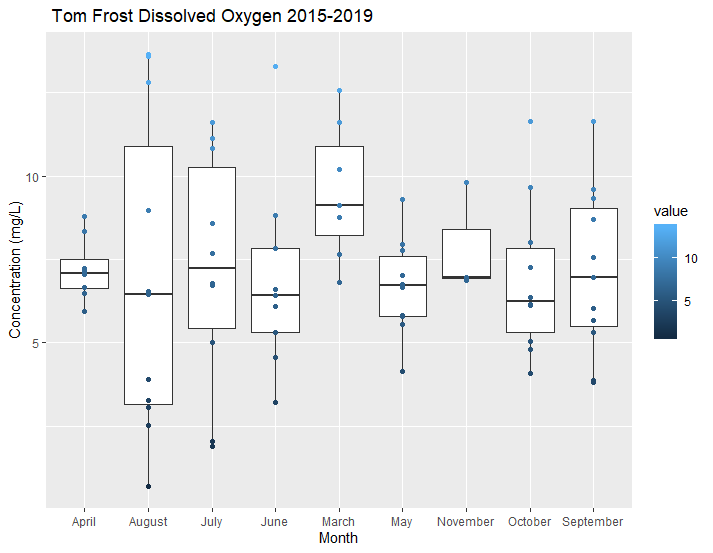
I have a graph made but the dates on my xaxis are out of order. I would like them to go chronologically from March-November. I have included the code that I have an an image of the graph.


Months<-gather(Month, type, value)

p<-ggplot(Months, aes(type, value), na.rm=TRUE)

p + geom_boxplot(fill= "white", na.rm=TRUE)  +
  geom_point(aes(color = value)) + ggtitle(" Tom Frost Dissolved Oxygen 2015-2019 ") + 
  xlab("Month") + ylab("Concentration (mg/L)") 
  + theme(plot.title = element_text(hjust = 0.5))

Your type column is being graphed as a factor in alphabetical order. You should be able to fix that with

Months$type <- factor(Months$type, levels = c("March", "April", "May", "June", "July", "August", 
                  "September", "October", "November"))
1 Like

Hi,

Three things:

  1. A reproducible example, called a reprex is helpful to show changes needed. The data contents in the example are invisible.
  2. From help(geom_boxplot()
library(ggplot2)
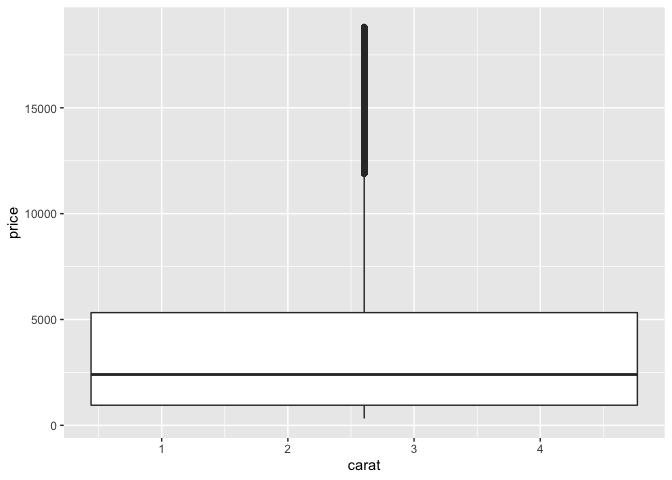
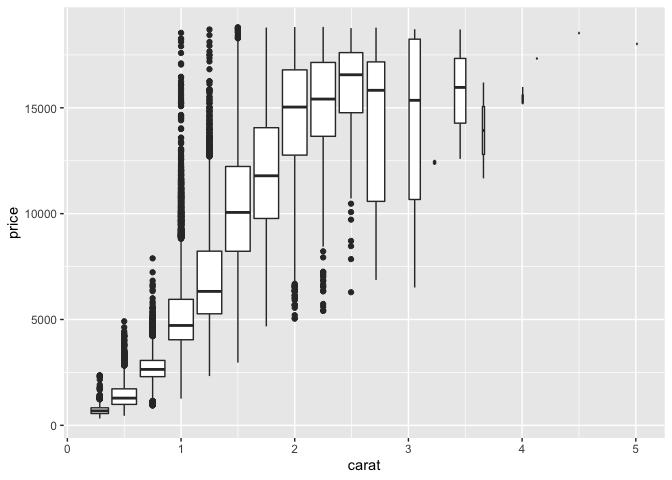
# You can also use boxplots with continuous x, as long as you supply
# a grouping variable. cut_width is particularly useful
ggplot(diamonds, aes(carat, price)) +
  geom_boxplot()
#> Warning: Continuous x aesthetic -- did you forget aes(group=...)?

ggplot(diamonds, aes(carat, price)) +
  geom_boxplot(aes(group = cut_width(carat, 0.25)))

Created on 2020-01-14 by the reprex package (v0.3.0)

  1. If Month is character, rather than a datetime object, the default is alphabetic. To change the order, convert to factors and reset the order with a vector of month name with factor(Months, levels = my_levels)

Come back with a reprex if you have trouble.

2 Likes

This topic was automatically closed 21 days after the last reply. New replies are no longer allowed.