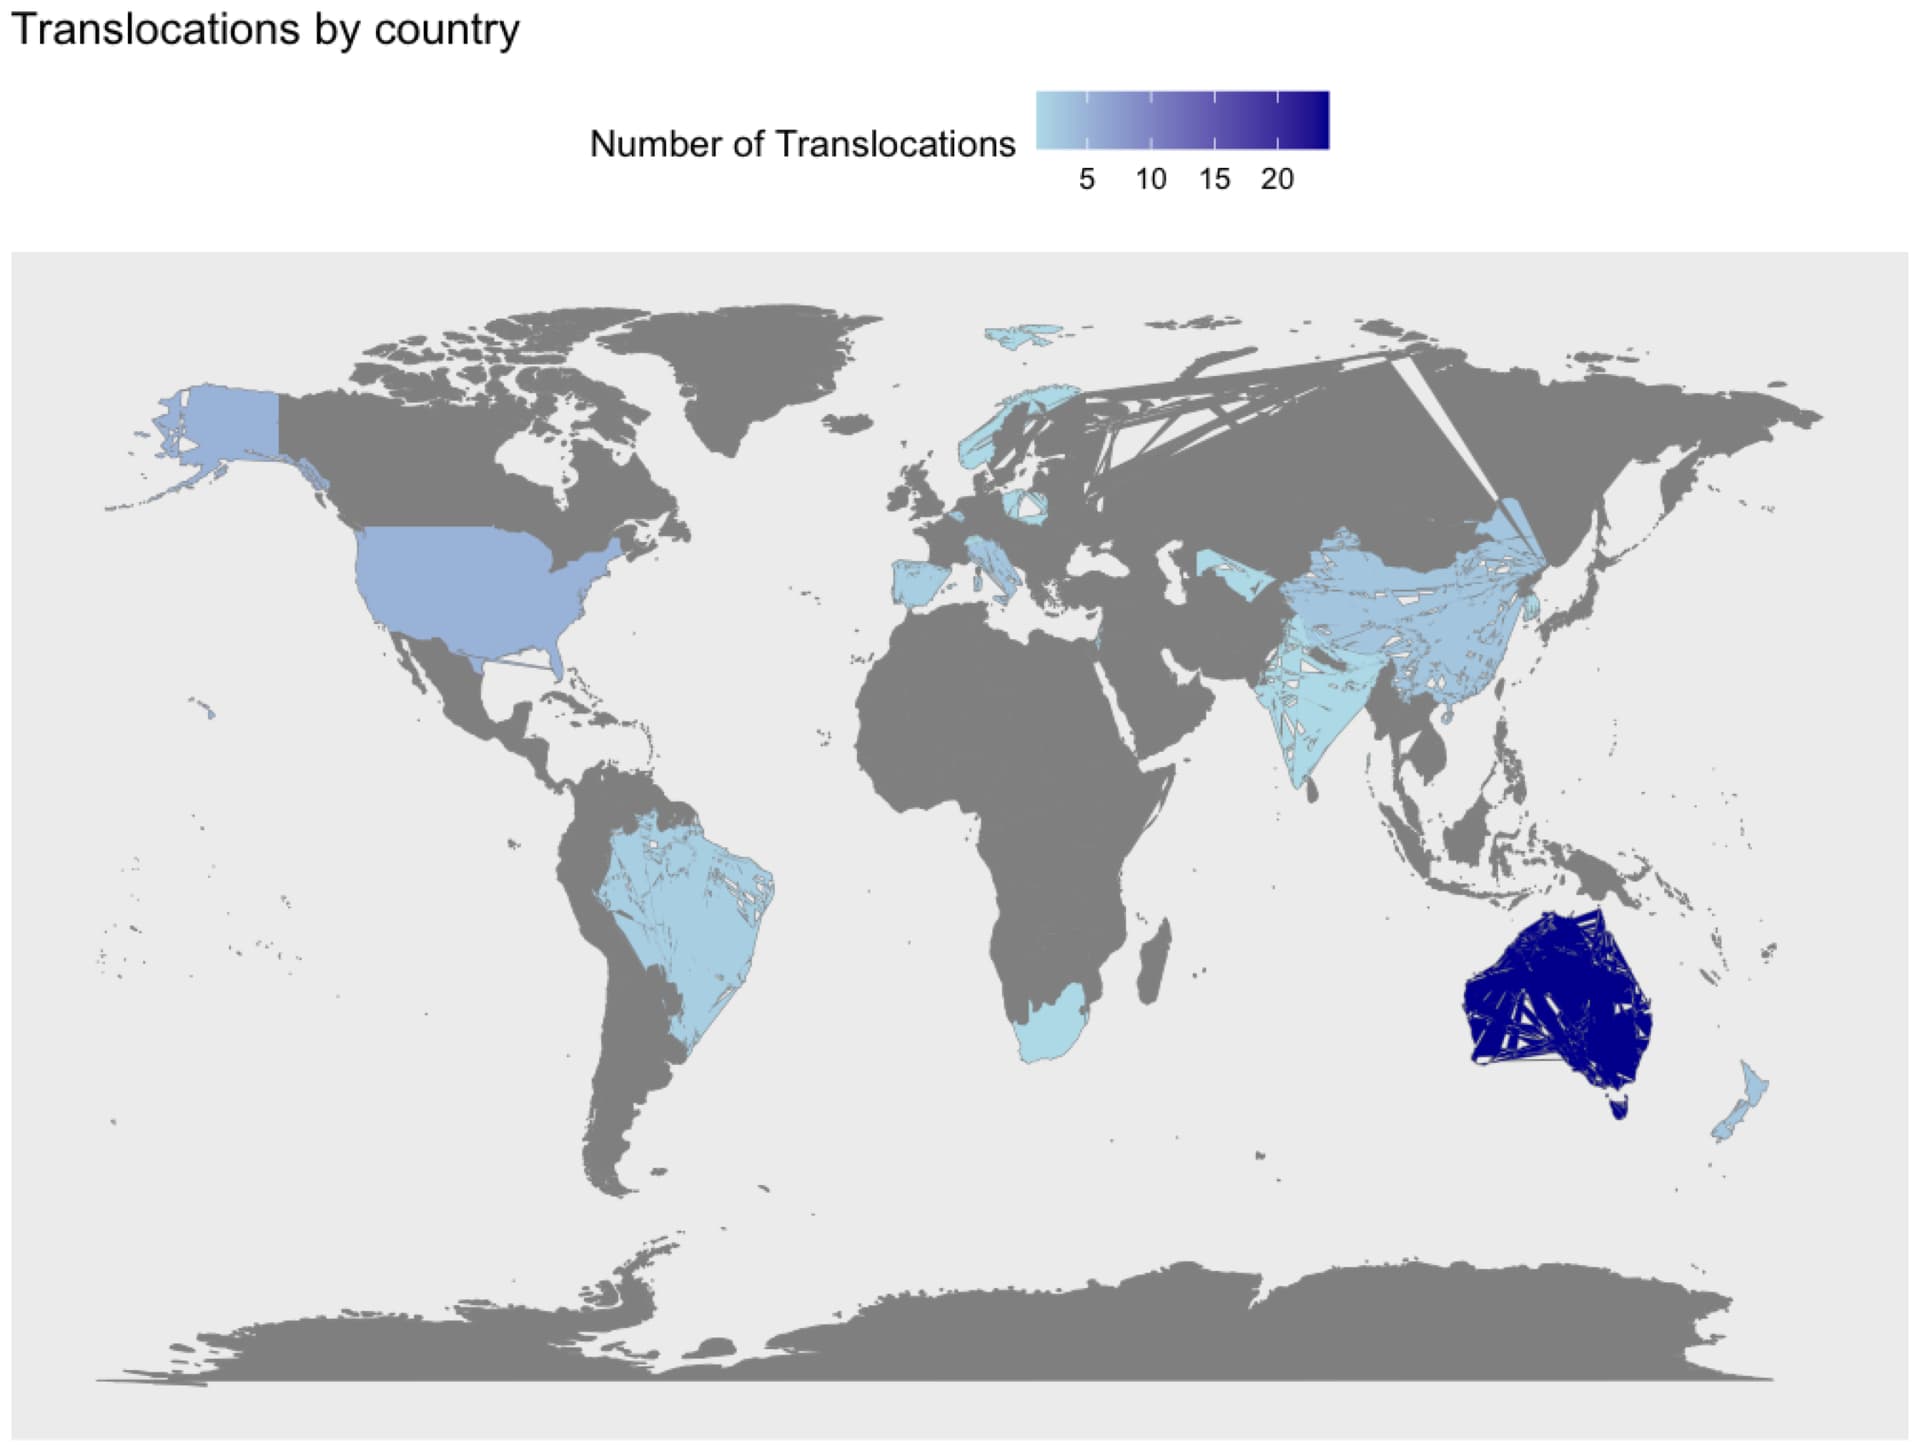
I'm trying to create a world map to indicate where documented plant translocations have occurred. What is the error that is causing the problem with my world map image?
Hello! To help us get the data and code, I usually recommend people follow the suggestions here to provide it in an easy format. Also, could you explain more about what "error" you are experiencing? The map looks to be a reasonable representation about what you are trying to model.
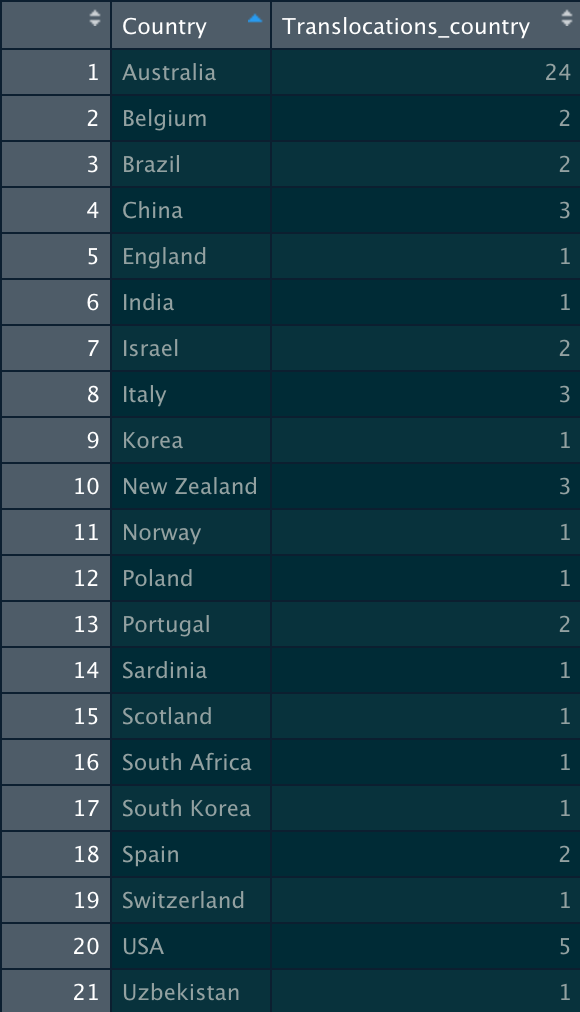
I've noticed something while playing around with this. Your "Country" column does not have matching countries for certain regions in the map data. For example, there is no "England" in the map data but there is a "UK" and there is no "Korea", but there is "South Korea". I suspect this may be causing issues.
Got it! I think merge() may have been causing problems so I switched it for inner_join(). I also switched to geom_polygon() as demonstrated here. There are places you can change color as you'd like. I used the "Country.xlsx" you provided through your picture in your first posting.
library(readxl)
library(tidyverse)
library(dplyr)
library(maps)
library(ggplot2)
library(ggthemes)
library(sf)

country_data <- read_excel("Country.xlsx")

country_data[country_data == "England"] <- "UK"
country_data[country_data == "Korea"] <- "South Korea"

og_world_map <- ggplot2::map_data("world")

world_map <- inner_join(
  og_world_map,
  country_data,
  by = join_by(region == Country)
)

gg <- ggplot(
  data    = world_map,
  mapping = aes(
    x     = long,
    y     = lat,
    group = group
  )
) +
  geom_polygon(
    data  = og_world_map,
    fill  = "white",
    color = "gray"
  ) +
  geom_polygon(
    mapping = aes(fill = Translocations_country)
  ) +
  scale_fill_gradient(
    low  = "lightblue",
    high = "darkblue",
    name = "Number of Translocations"
  ) +
  expand_limits(
    x = world_map$long,
    y = world_map$lat
  ) +
  labs(
    x     = "",
    y     = "",
    title = "Translocations by country"
  ) +
  theme(
    panel.grid   = element_blank(),
    panel.border = element_blank()
  ) +
  theme(
    axis.ticks = element_blank(),
    axis.text  = element_blank()
  )  +
  theme(legend.position = "top")

gg