I have a ggplot-plot with facets. And I would like to see only those x axis labels for which data points exist in each single facet. I am aware that I could construct the plots individually and put them together with e.g. patchwork. But I was wondering whether there is a general solution to this without going the extra mile. Maybe I am missing something very obvious?
library(tidyverse)
x <- mtcars %>%
mutate(group=case_when(carb %in% c(1,2,4) ~ "A",
TRUE ~ "B")) %>%
group_by(group, carb) %>%
summarise(qsec.mean=mean(qsec))
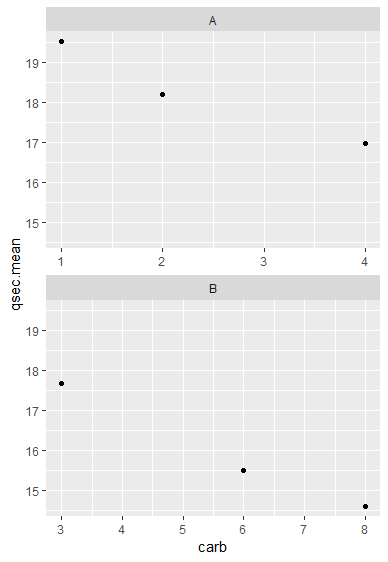
x %>%
ggplot()+
geom_point(aes(x=carb, y=qsec.mean))+
facet_wrap(vars(group), scales="free_x", nrow=2)
For example, in the plot below I would like to see only the labels for 1,2, and 4 for group A, and 3, 6, and 8 for group B.
Many thanks.
UPDATE: I am aware that I can add scale_x_continuous(breaks=x$carb, labels=x$carb). This removes 'empty' x labels, but keeps those overlapping with another facet (e.g. label for the value 4 shows up in facet A and B, although the data point is only in fact A).