There's plenty in the ggplot2 docs about inserting Greek characters in plot titles, axis titles and facet labels (using expression() in the first two cases and label_bquote() in the latter), but when it comes to customising axis ticks, the docs recommend supplying a function to labels in scale_(x|y)_continuous.
On my Mac, both of the following work great:
library(tidyverse)
df1 = data_frame(x = 1:10, y = rnorm(10))
# works
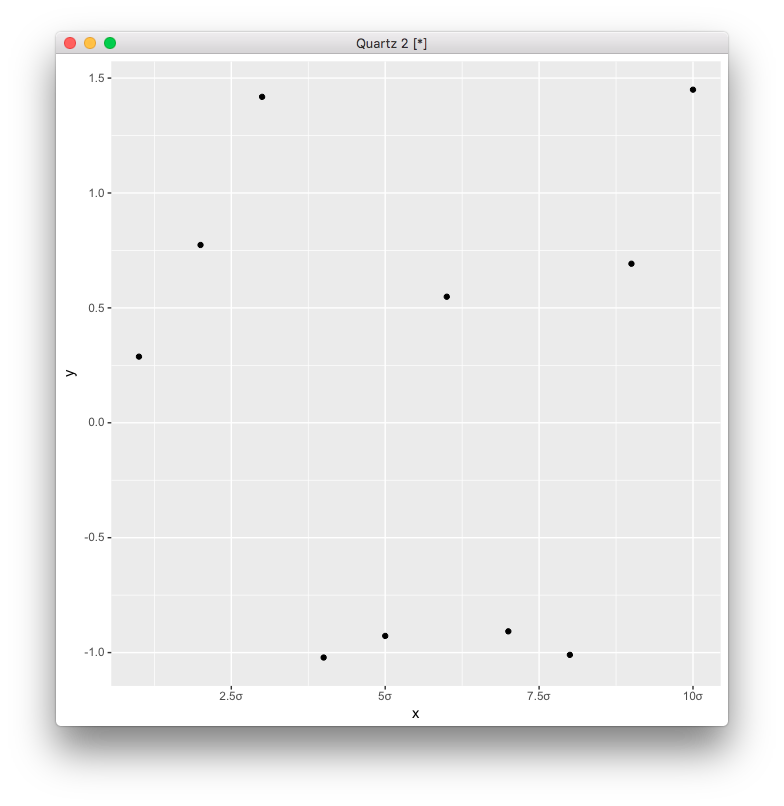
ggplot(df1) + geom_point(aes(x, y)) + scale_x_continuous(labels = function(x) paste0(x, 'σ'))
# works
ggplot(df1) + geom_point(aes(x, y)) + scale_x_continuous(labels = function(x) paste0(x, '\U03C3'))
But when I try to run this code on my organisation's Linux server, the sigmas are replaced by .. in the (PDF) plot output. Is this a platform- or setup-specific problem, or am I just not doing this the Right Way?

 .
.

 . I don't use Linux, however I would guess that you are on the right path and that it is probably a character encoding issue.