I would like to plot (with ggplot2) a graphic like this one:
.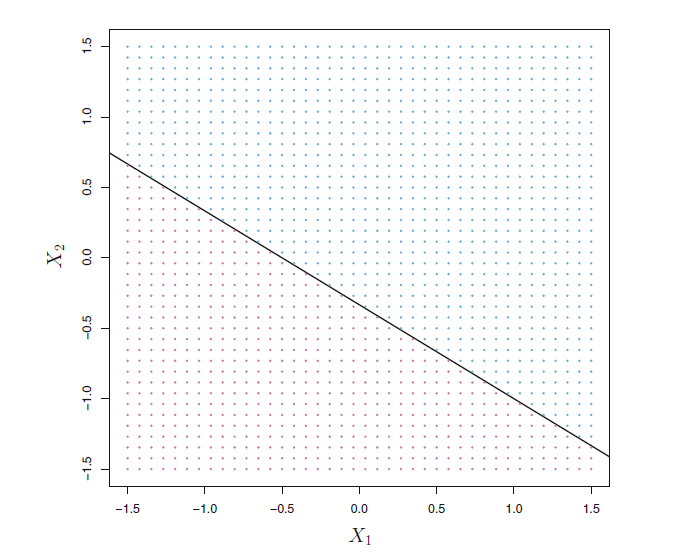
I mean, to plot a line and to plot each half of the plain with aligned small dots.
Could anyone help me?
I would like to plot (with ggplot2) a graphic like this one:
.I mean, to plot a line and to plot each half of the plain with aligned small dots.
Could anyone help me?
Here is one way to do it.
library(ggplot2)
library(dplyr, warn.conflicts = FALSE)


Values <- seq(-1.5, 1.5, length.out = 40)
DF <- data.frame(X1 = rep(Values, 40), X2 = rep(Values, each = 40))
DF <- DF %>% mutate(PlotX2 = -X1 - 0.25,
                    Side = ifelse(X2 < -X1 - 0.25, "low", "high"))
ggplot(DF) + geom_point(aes(X1, X2, color = Side), size = 0.3) +
  geom_line(aes(X1, PlotX2))

Created on 2021-03-25 by the reprex package (v0.3.0)
This topic was automatically closed 7 days after the last reply. New replies are no longer allowed.
If you have a query related to it or one of the replies, start a new topic and refer back with a link.