Hi, I´m trying to make a ggplot and my data are weighted. Depends of the way I do it I have different results. Here is the code:
my_data <- tibble(Var_1 = c(900, 1500, 350, 1200, 750, 100,125,250,300),
                  Var_2 = c(385, 988, 150, 355,555, 900,20, 25, 500),
                  my_weights = c(2.2, 3.1, 8.2, 4.2, 5.3, 6.8, 12, 25, 1))
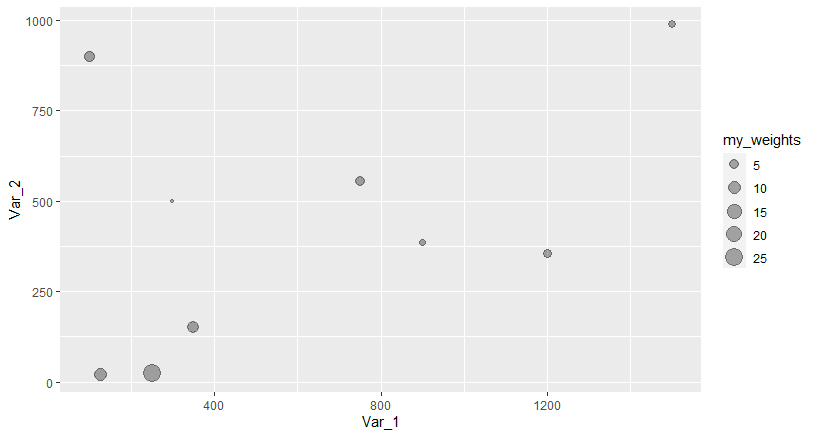
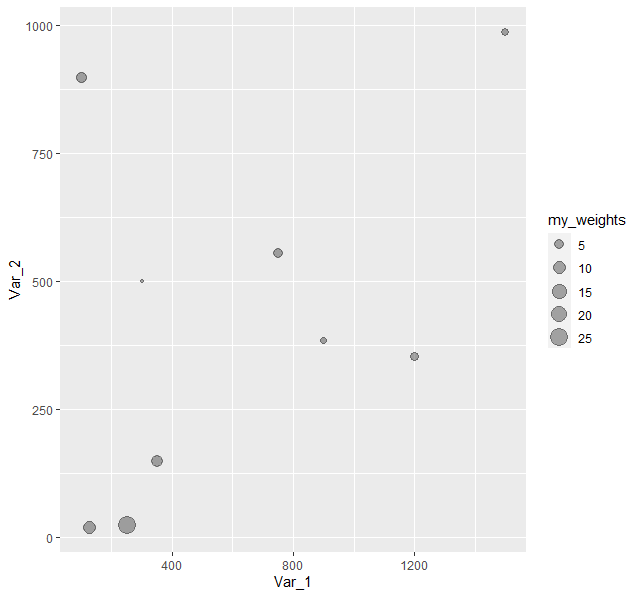
If I use size inside the ggplot aes () I obtain this
ggplot(my_data, aes(Var_1, Var_2, size = my_weights))+
  geom_point(alpha=1/3)
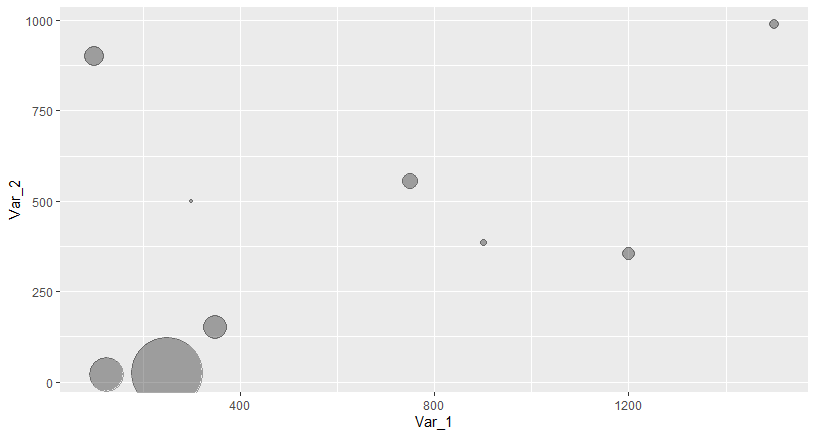
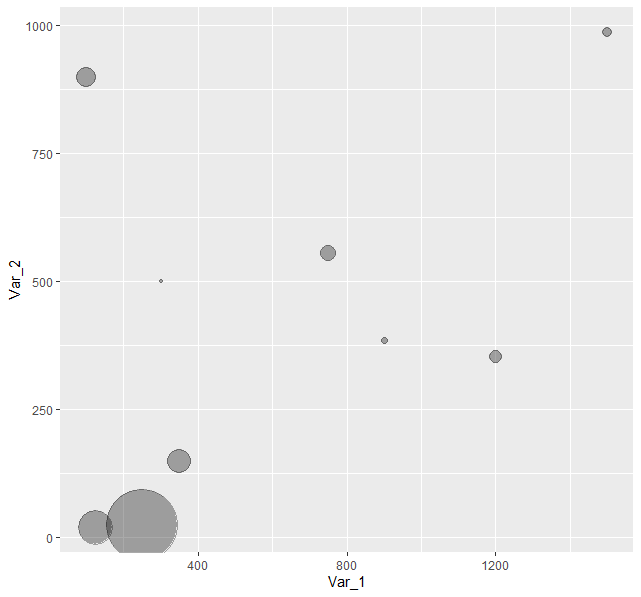
But if I use the weights inside the geom_point() aes looks like this:
ggplot(my_data, aes(Var_1, Var_2))+
  geom_point( size = my_data$my_weights, alpha=1/3)
I am a bit confused. Should Not be the same result?