rama27
1
Hi, I have a following problem. I would like to make a ggplot and set width for one particular line.
See my example:
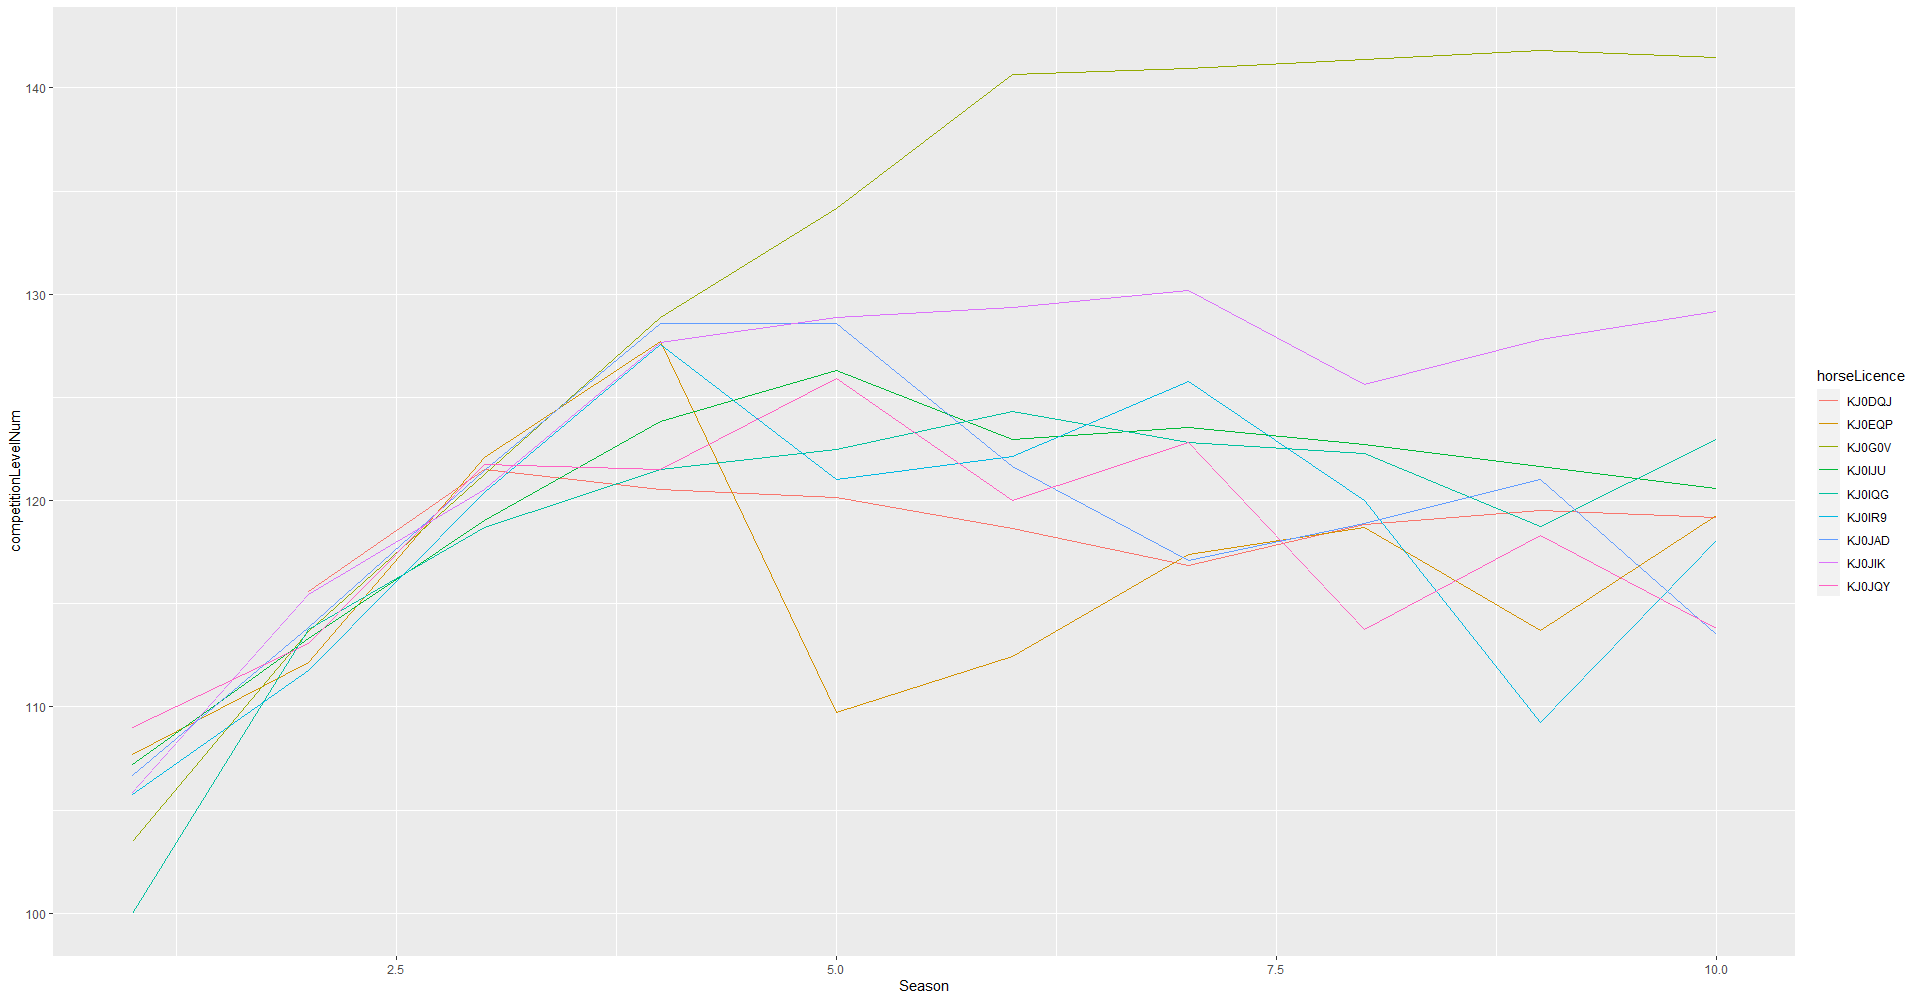
ggplot(final_data) +
  geom_line(aes( x = Season, y = competitionLevelNum, color= horseLicence ) )
In other words - If and only if horseLicence = "KJ0G0V", make the width of the line 0.5.
But when I try this:
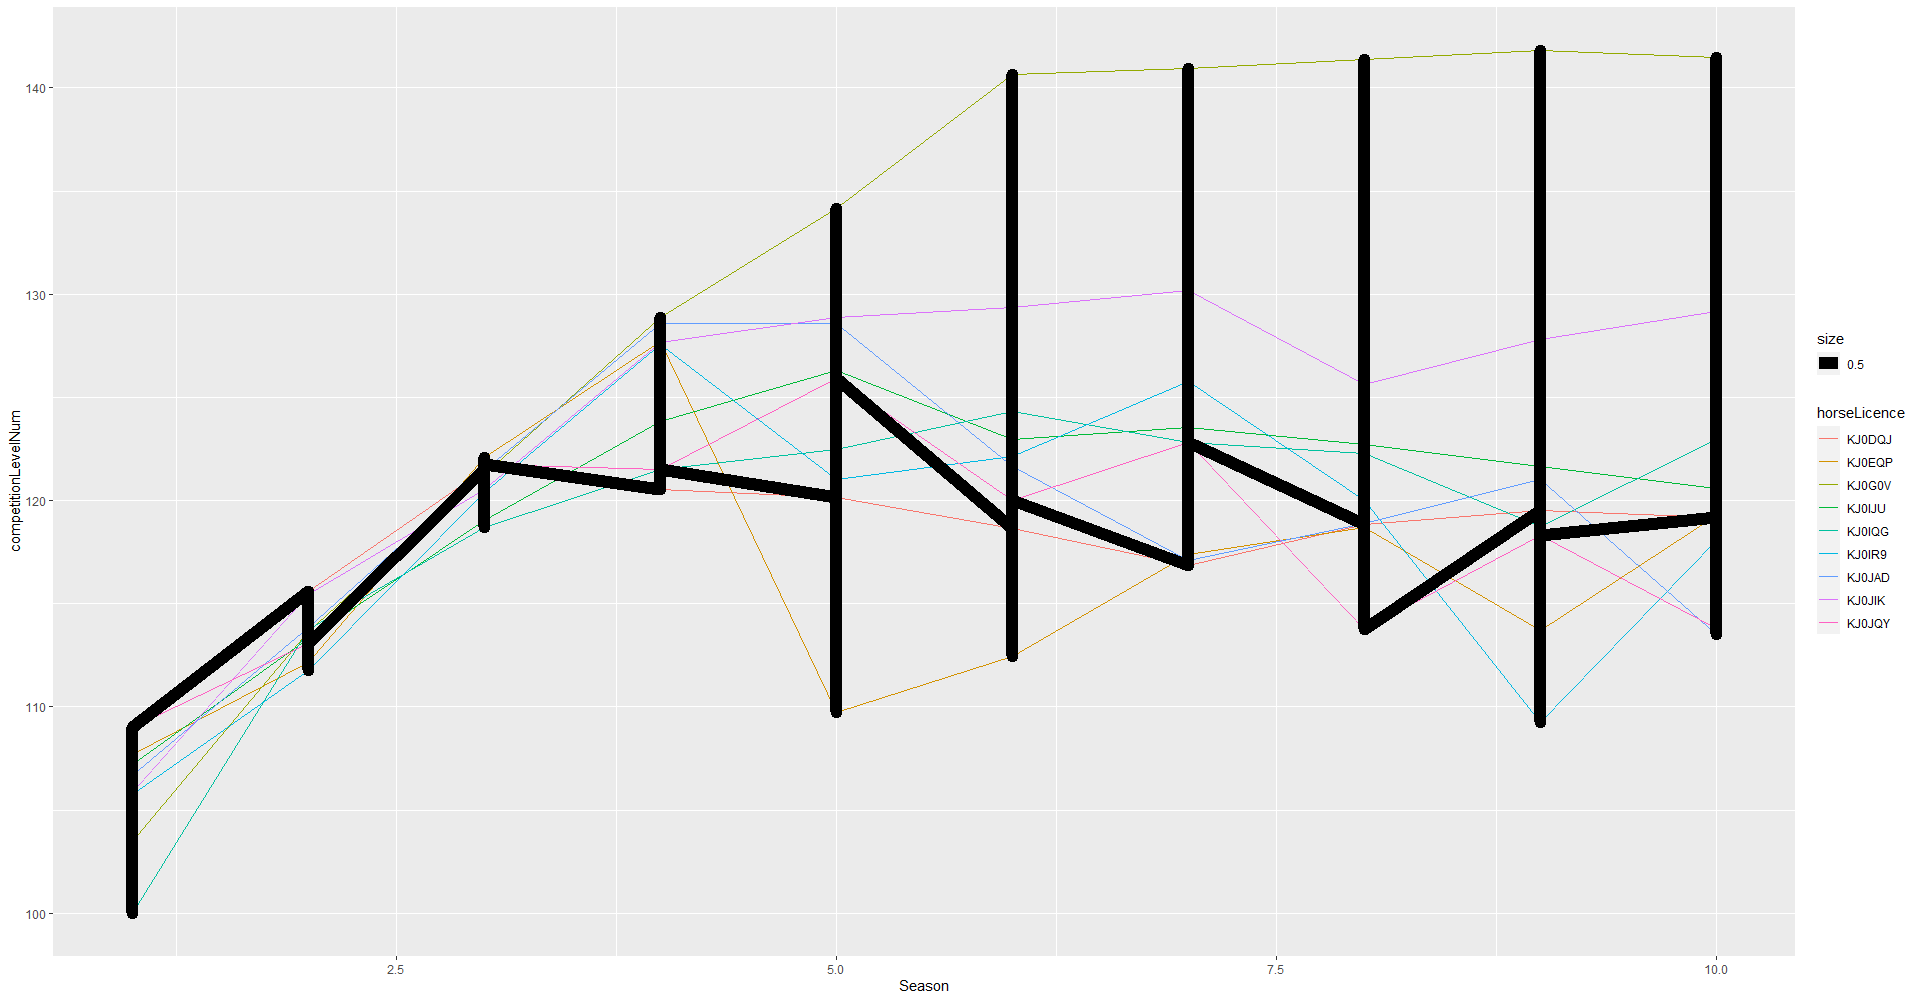
ggplot(final_data) +
  geom_line(aes( x = Season, y = competitionLevelNum, color= horseLicence ) ) +
  geom_line(aes( x = Season, y = competitionLevelNum, horseLicence = "KJ0G0V", lwd=0.5))
I got a nonsense with a warning message "Ignoring unknown aesthetics: horseLicence ".
Can someone help me, please? Thanks a lot!
There are a number of ways to do this, depending on your data and use case. I particularly like gghighlight -- this vignette describes the many options it has. Here are a few examples:
library(tidyverse)
set.seed(1)
df <- tibble(
time = rep(1:5, 3),
class = rep(letters[1:3], 5),
value = rnorm(15)
)
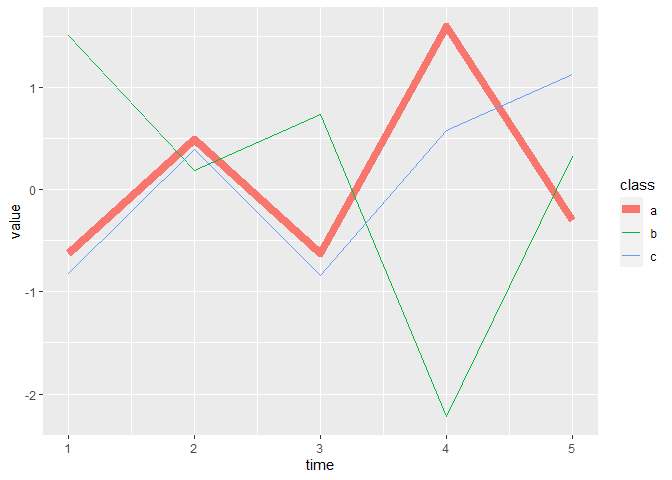
# set size of lines manually
df %>%
ggplot(aes(time, value, color = class)) +
geom_line(aes(size = class)) +
scale_size_manual(values = c(a = 3, b = 0.5, c = 0.5))
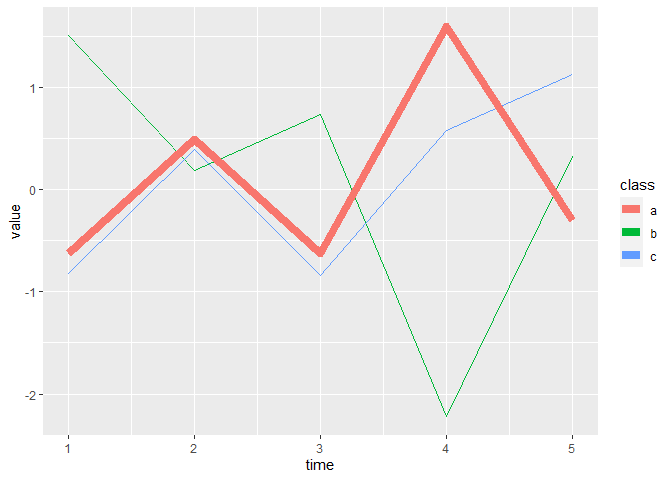
# draw wider line separately from others and set size
df %>%
  filter(class != "a") %>%
  ggplot(aes(time, value, color = class)) +
  geom_line() +
  geom_line(data = filter(df, class == "a"), size = 3)
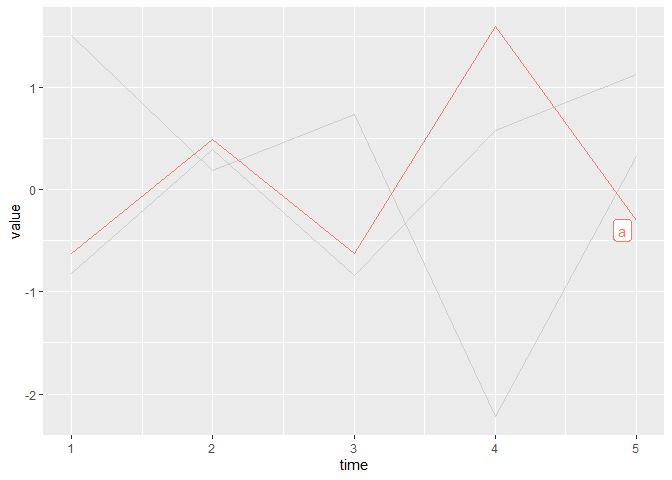
# use gghighlight()
df %>%
  ggplot(aes(time, value, color = class)) +
  geom_line() +
  gghighlight::gghighlight(class == "a")
Created on 2020-06-01 by the reprex package (v0.3.0)
2 Likes
system
Closed
3
This topic was automatically closed 7 days after the last reply. New replies are no longer allowed.