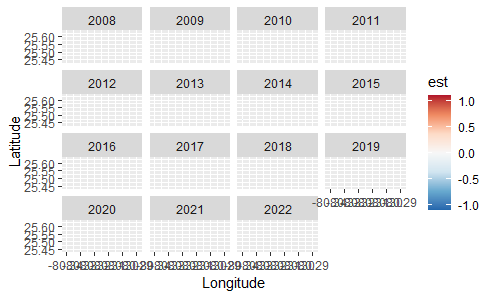
When I use my own data, ggplot keeps giving me this error message and producing a blank plot, but when I try it with simulated data it works fine. Any thoughts?
library("gratia")
library("mgcv")
library("ggplot2")
library("dplyr")

m2 <- bam(occur ~ s(temp) +
           s(DO) +
           sed_depth +
           s(ToD, bs = 'cc') +
           s(DoY, bs = 'cc') +
           s(Longitude, Latitude, bs = 'tp') +
           ti(Longitude, Latitude, CYR, d = c(2,1), bs = c('ds','cr')) +
           s(fCYR, bs = "re") +
           s(fSite, bs = "re"),
         data = toad,
         method = 'fREML',
         nthreads = 4,
         discrete = TRUE,
         family = binomial(link = "logit"),
         select = TRUE,
         gamma = 1.5)

sms <- smooth_estimates(m2, smooth = "ti(CYR,Longitude,Latitude)", data = toad)

> dim(sms)
[1] 1355    8

> dput(sms[1:5,])
structure(list(smooth = c("ti(CYR,Longitude,Latitude)", "ti(CYR,Longitude,Latitude)",
"ti(CYR,Longitude,Latitude)", "ti(CYR,Longitude,Latitude)", "ti(CYR,Longitude,Latitude)"
), type = c("Tensor product int.", "Tensor product int.", "Tensor product int.",
"Tensor product int.", "Tensor product int."), by = c(NA_character_,
NA_character_, NA_character_, NA_character_, NA_character_),
    est = c(0.117025782747128, 0.113479508095921, 0.0933787695695134,
    0.0895995641580288, 0.0755531029189105), se = c(0.185913143579915,
    0.181005541009251, 0.152005779645215, 0.142402142342131,
    0.119622723237741), CYR = c(2008L, 2008L, 2008L, 2008L, 2008L
    ), Longitude = c(-80.30257, -80.30335, -80.3075, -80.30756,
    -80.31002), Latitude = c(25.5694, 25.56841, 25.56183, 25.55802,
    25.55185)), row.names = c(NA, -5L), class = c("smooth_estimates",
"tbl_df", "tbl", "data.frame"), tensor_term_order = list(`ti(CYR,Longitude,Latitude)` = c("Longitude",
"Latitude", "CYR")))

est_lim <- c(-1, 1) * max(abs(sms[["est"]]), na.rm = TRUE)

sms |>
  mutate(fCYR = factor(CYR)) |>
  ggplot(aes(x = Longitude, y = Latitude, fill = est, group = fCYR)) +
  geom_raster(aes(x = Longitude, y = Latitude, fill = est, group = fCYR)) +
  geom_contour(aes(z = est, group = fCYR, fill = NULL), colour = "black") +
  facet_wrap(~ fCYR) +
  scale_fill_distiller(palette = "RdBu", type = "div") +
  expand_limits(fill = est_lim)

There were 47 warnings (use warnings() to see them)

> warnings()
Warning messages:
1: `stat_contour()`: Zero contours were generated
2: In min(x) : no non-missing arguments to min; returning Inf
3: In max(x) : no non-missing arguments to max; returning -Inf
...
43: `stat_contour()`: Zero contours were generated
44: In min(x) : no non-missing arguments to min; returning Inf
45: In max(x) : no non-missing arguments to max; returning -Inf
46: Raster pixels are placed at uneven horizontal intervals and will be shifted
ℹ Consider using `geom_tile()` instead.
47: Raster pixels are placed at uneven horizontal intervals and will be shifted
ℹ Consider using `geom_tile()` instead.
Simulated data:
df <- data_sim("eg1", n = 1000,  dist = "normal", scale = 2, seed = 1)

m <- gam(y ~ te(x2, x0, x1, k = c(5, 20), d = c(1,2), bs = c("ds", "cr")),
         data = df, method = "REML")

sms <- smooth_estimates(m)

sms |>
    mutate(fx2 = factor(x2)) |>
    ggplot(aes(x = x0, y = x1, fill = est, group = fx2)) +
    geom_raster(aes(x = x0, y = x1, fill = est, group = fx2)) +
    geom_contour(aes(z = est, group = fx2, fill = NULL), colour = "black") +
    facet_wrap(~ fx2) +
    scale_fill_distiller(palette = "RdBu", type = "div") +
    expand_limits(fill = est_lim)