Hi,
I have a problem with some R Studie code. I am totally new! It is the first time I am trying to make a GGPLOT. I have the following code (the values are fictive in this dataset):
library(tidyr)
library(ggplot2)
library(dplyr)
#plot with CI
r_data_2 <- data.frame(time = c("January", "February", "March", "April", "May", "June"),
Cake = c(12,26,39,37,40,28),
NoCake = c(1,2,3,1,5,4))
r_datatall_2 <- r_data_2 %>% gather(key=test, value, Cake:NoCake)
r_datatall_2
r_datatall_2$n <- c(13,28,42,38,45,32,13,28,42,38,45,32)
#percent
r_datatall_2$prop <- r_datatall_2$value/r_datatall_2$n*100
#calculateCI intervals
r_datatall_2$ci_low <- ((r_datatall_2$value/r_datatall_2$n)-1.96*sqrt(((r_datatall_2$value/r_datatall_2$n)*(1-(r_datatall_2$value/r_datatall_2$n)))/r_datatall_2$n))*100
r_datatall_2$ci_hi <- ((r_datatall_2$value/r_datatall_2$n)+1.96*sqrt(((r_datatall_2$value/r_datatall_2$n)*(1-(r_datatall_2$value/r_datatall_2$n)))/r_datatall_2$n))*100
r_datatall_2$ci <- r_datatall_2$prop-r_datatall_2$ci_low
#plot bars with CI-intervals
ggplot(r_datatall_2, aes(time, prop, fill = test)) +
geom_bar(position ='dodge', stat='identity') +
geom_text(aes(label=value), position=position_dodge(width=0.9), vjust=-5.5) +
labs(y="Percent (%)", x="", fill="", legend=c("A","B")) +
ylim(0,120)+
scale_fill_brewer(palette="Paired", labels = c("Cake","No Cake"))+
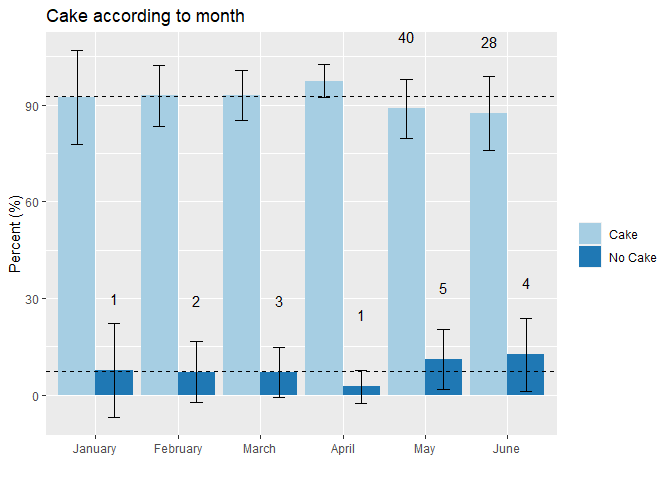
ggtitle("Cake according to month")+
geom_errorbar(aes(ymin=ci_low, ymax=ci_hi, x=time), position=position_dodge(0.9), width = 0.3)
I have several issues:
- The months are not in proper order?
- The errorbars are not complete (in the bottom) and often 'hits' the value above?
- Is it possible to place e.g. a line plot of a median across the months? So both the line plot (in this case one line) and the bar plots are displayed?
Thanks a lot!