Dear Community,
I am very new to R and just starting to get in touch - I hope, this question is not far too basic and useless, but I could not find a solution for my problem on the web so far...
I am trying to do some basic graphs with ggplot2, however do not get any results in R Studio, the "plots"-window is alway just showing the coordinate system. An example would be:
library(ggplot2)
x <- (1:10)
y <- (1:10)
dt <- data.frame(one = x, two = y)
graph <- ggplot(dt, aes(one, two))
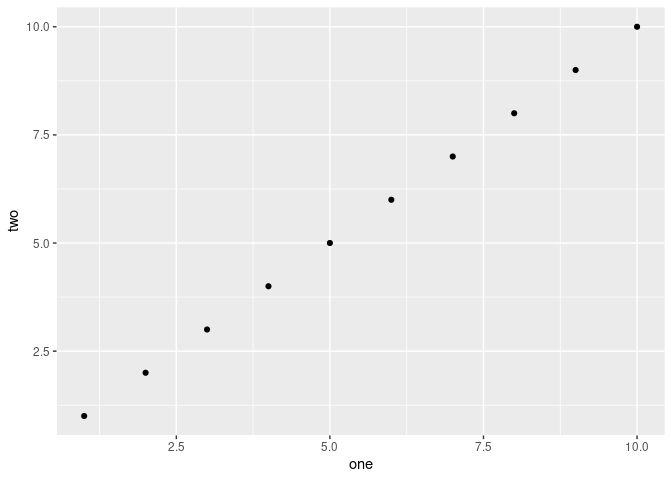
graph + geom_point()
print(graph)
Running this code I just see an appropriate coordinate system, as shown in the screen shot. According to my book I should see some points...
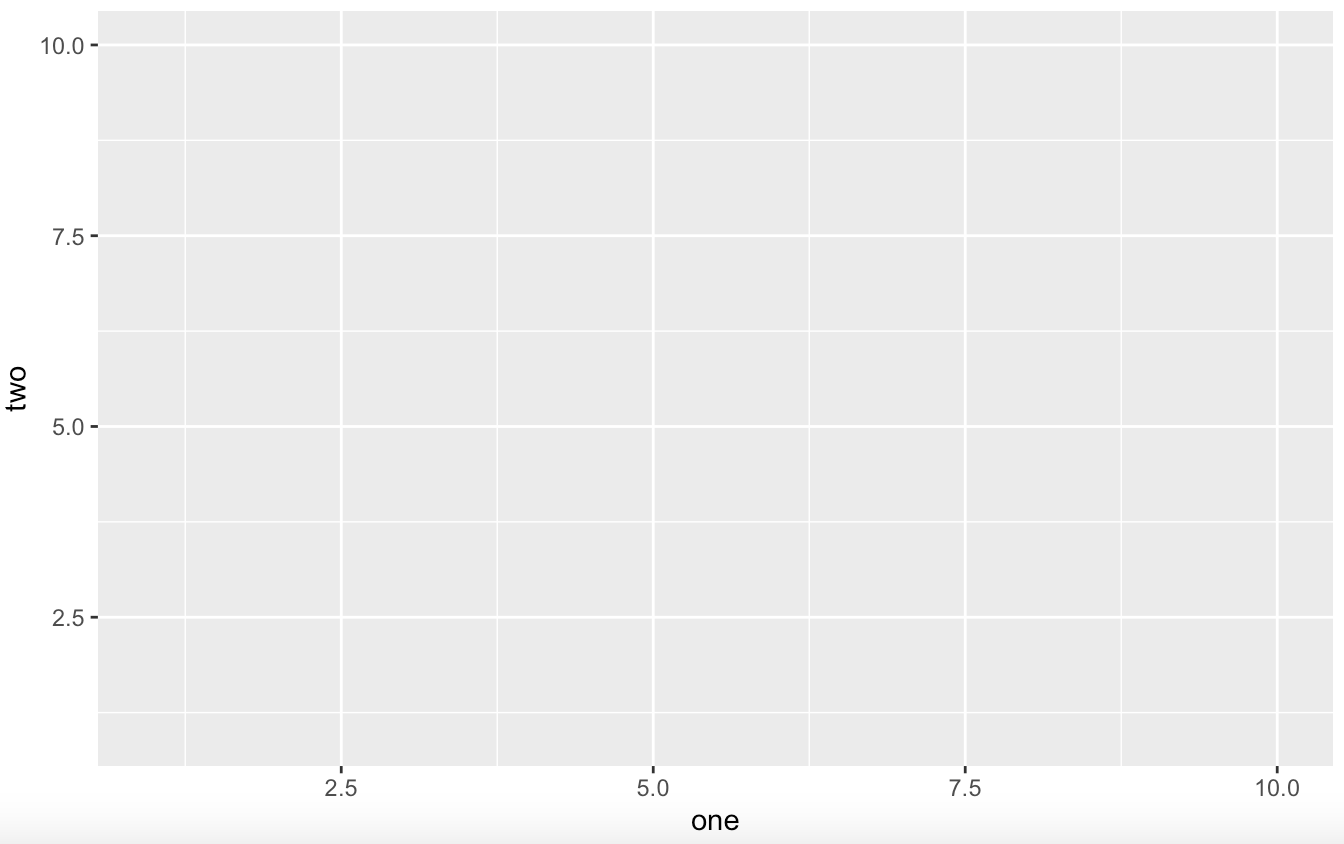
Maybe someone can help? Thank you for your time!
Best regards!